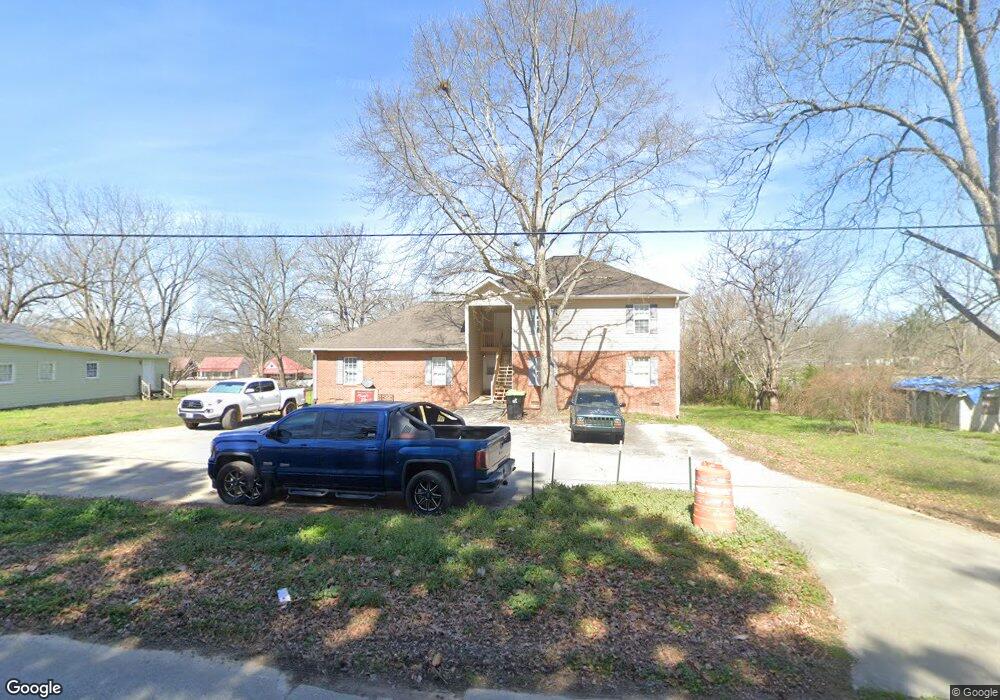
175 Meadow St Tallapoosa, GA 30176
Estimated Value: $240,500
--
Bed
--
Bath
1,960
Sq Ft
$123/Sq Ft
Est. Value
About This Home
This home is located at 175 Meadow St, Tallapoosa, GA 30176 and is currently priced at $240,500, approximately $122 per square foot. 175 Meadow St is a home located in Haralson County with nearby schools including Haralson County High School.
Ownership History
Date
Name
Owned For
Owner Type
Purchase Details
Closed on
Mar 24, 2015
Sold by
Ingram Darrell
Bought by
Dmi & Associates Llc
Current Estimated Value
Purchase Details
Closed on
Sep 2, 2010
Sold by
Hsbc Bank Usa National Ass
Bought by
Ingram Darrell
Purchase Details
Closed on
Nov 3, 2009
Sold by
Sayfadeen Zheyan
Bought by
Hsbc Bank Usa National Associa
Purchase Details
Closed on
Jun 26, 2006
Sold by
Prichard Darryl
Bought by
Zheyan Sayfadeen
Home Financials for this Owner
Home Financials are based on the most recent Mortgage that was taken out on this home.
Original Mortgage
$140,000
Interest Rate
6.55%
Mortgage Type
Commercial
Purchase Details
Closed on
Nov 19, 2002
Sold by
Edwards Terry T and Deese Shannon R
Bought by
Prichard Darryl and Prichard Joelle W
Purchase Details
Closed on
Aug 18, 2000
Sold by
Robinson Sammy L and Burns Robert M
Bought by
Edwards Terry T and Deese Shannon
Purchase Details
Closed on
Jul 17, 1992
Sold by
Payne Ralph
Bought by
Robinson Sammy L and Burns Robert
Create a Home Valuation Report for This Property
The Home Valuation Report is an in-depth analysis detailing your home's value as well as a comparison with similar homes in the area
Home Values in the Area
Average Home Value in this Area
Purchase History
| Date | Buyer | Sale Price | Title Company |
|---|---|---|---|
| Dmi & Associates Llc | -- | -- | |
| Ingram Darrell | $60,500 | -- | |
| Ingram Darrell | $60,500 | -- | |
| Hsbc Bank Usa National Associa | $137,000 | -- | |
| Zheyan Sayfadeen | $175,000 | -- | |
| Prichard Darryl | $12,500 | -- | |
| Edwards Terry T | $7,000 | -- | |
| Robinson Sammy L | $22,000 | -- |
Source: Public Records
Mortgage History
| Date | Status | Borrower | Loan Amount |
|---|---|---|---|
| Previous Owner | Zheyan Sayfadeen | $140,000 |
Source: Public Records
Tax History Compared to Growth
Tax History
| Year | Tax Paid | Tax Assessment Tax Assessment Total Assessment is a certain percentage of the fair market value that is determined by local assessors to be the total taxable value of land and additions on the property. | Land | Improvement |
|---|---|---|---|---|
| 2024 | $2,079 | $65,986 | $8,500 | $57,486 |
| 2023 | $1,527 | $61,126 | $8,160 | $52,966 |
| 2022 | $1,578 | $61,126 | $8,160 | $52,966 |
| 2021 | $1,648 | $61,126 | $8,160 | $52,966 |
| 2020 | $1,653 | $61,126 | $8,160 | $52,966 |
| 2019 | $1,722 | $61,380 | $8,160 | $53,220 |
| 2018 | $1,742 | $61,380 | $8,160 | $53,220 |
| 2017 | $1,911 | $61,377 | $8,160 | $53,217 |
| 2016 | $1,148 | $61,510 | $8,160 | $53,350 |
| 2015 | $1,848 | $63,061 | $9,600 | $53,462 |
| 2014 | $1,907 | $63,194 | $9,600 | $53,594 |
Source: Public Records
Map
Nearby Homes
- 4493 Stone Mountain St
- 117 White St
- 2633 Georgia 120 (485 53 Acres)
- 20 S Kelley St
- 75 Rose St
- 244 Monroe St
- 0 W Mill St Unit 10604030
- 0 W Mill St Unit 7649366
- 250 Kiker St
- 124 S Kelley St
- 0 Providence Lake Rd Unit 10576961
- 267 Williams St
- 270 Head Ave
- 0 Stone Mountain St Unit 24639770
- 0 Stone Mountain St Unit 10465113
- 281 Alewine Ave
- 438 Bowdon St
- 0 Georgia 120 Unit 7646686
- 0 Georgia 120 Unit 10600882
- 0 Broad St Unit 10614514
- 183 Meadow St
- 0 Meadow St Unit 3199451
- 0 Meadow St Unit 8719846
- 0 Meadow St Unit 8510370
- 0 Meadow St Unit 8660096
- 0 Meadow St Unit 8095451
- 0 Meadow St Unit 8012869
- 0 Meadow St Unit 8690289
- 0 Meadow St Unit 7216470
- 161 Meadow St
- 189 Meadow St
- 172 Meadow St
- 184 Meadow St
- 195 Meadow St
- 162 Meadow St
- 151 Meadow St
- 199 Meadow St
- 194 Meadow St
- 150 Meadow St
- 207 Meadow St