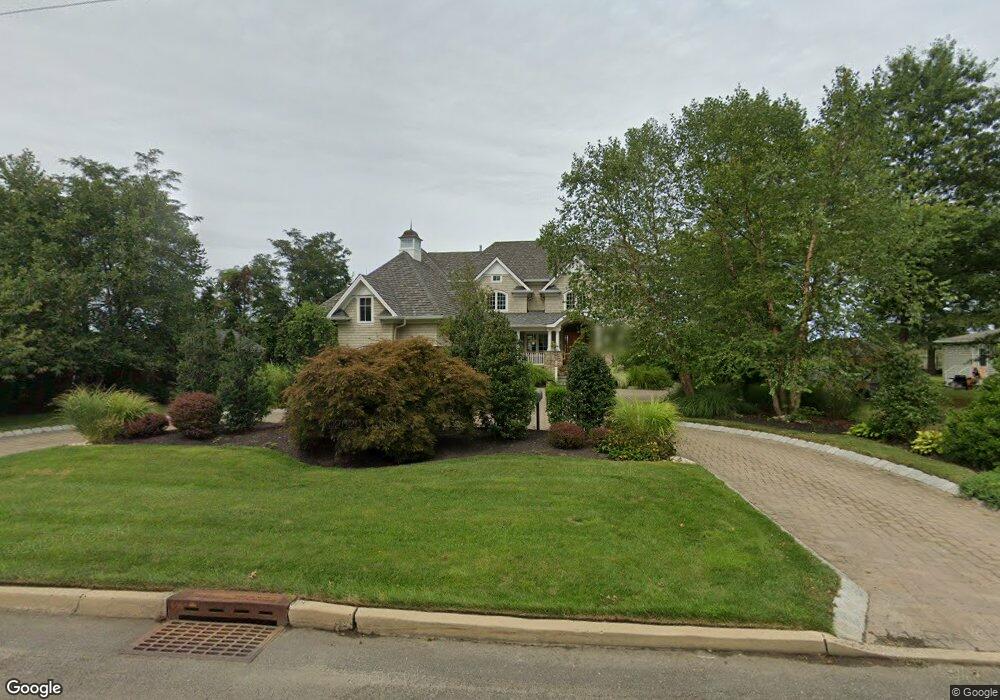
175 Monmouth Blvd Oceanport, NJ 07757
Estimated Value: $2,867,224 - $3,742,000
5
Beds
3
Baths
7,494
Sq Ft
$436/Sq Ft
Est. Value
About This Home
This home is located at 175 Monmouth Blvd, Oceanport, NJ 07757 and is currently estimated at $3,270,556, approximately $436 per square foot. 175 Monmouth Blvd is a home located in Monmouth County with nearby schools including Wolf Hill Elementary School, Maple Place Elementary and Middle School, and Shore Regional High School.
Ownership History
Date
Name
Owned For
Owner Type
Purchase Details
Closed on
May 7, 2004
Sold by
Robinson Harry
Bought by
Lucarelli Anthony
Current Estimated Value
Purchase Details
Closed on
Oct 15, 1993
Sold by
Hughes Alexander
Bought by
Robinson Harry and Stromp Nancy
Home Financials for this Owner
Home Financials are based on the most recent Mortgage that was taken out on this home.
Original Mortgage
$203,000
Interest Rate
6.78%
Create a Home Valuation Report for This Property
The Home Valuation Report is an in-depth analysis detailing your home's value as well as a comparison with similar homes in the area
Home Values in the Area
Average Home Value in this Area
Purchase History
| Date | Buyer | Sale Price | Title Company |
|---|---|---|---|
| Lucarelli Anthony | $800,000 | -- | |
| Robinson Harry | $271,000 | -- |
Source: Public Records
Mortgage History
| Date | Status | Borrower | Loan Amount |
|---|---|---|---|
| Previous Owner | Robinson Harry | $203,000 |
Source: Public Records
Tax History Compared to Growth
Tax History
| Year | Tax Paid | Tax Assessment Tax Assessment Total Assessment is a certain percentage of the fair market value that is determined by local assessors to be the total taxable value of land and additions on the property. | Land | Improvement |
|---|---|---|---|---|
| 2025 | $33,244 | $2,237,800 | $892,700 | $1,345,100 |
| 2024 | $32,713 | $2,105,400 | $784,700 | $1,320,700 |
| 2023 | $32,713 | $1,965,900 | $694,700 | $1,271,200 |
| 2022 | $32,781 | $1,806,700 | $685,700 | $1,121,000 |
| 2021 | $32,781 | $1,720,800 | $640,700 | $1,080,100 |
| 2020 | $30,959 | $1,693,600 | $631,700 | $1,061,900 |
| 2019 | $29,907 | $1,660,600 | $622,700 | $1,037,900 |
| 2018 | $29,708 | $1,660,600 | $622,700 | $1,037,900 |
| 2017 | $31,341 | $1,453,000 | $426,100 | $1,026,900 |
| 2016 | $33,907 | $1,444,700 | $426,100 | $1,018,600 |
| 2015 | $32,205 | $1,552,800 | $426,100 | $1,126,700 |
| 2014 | $31,268 | $1,529,000 | $527,500 | $1,001,500 |
Source: Public Records
Map
Nearby Homes
- 3 Foggia Way
- 1 Foggia Way
- 10 Asbury Ave
- 27 Ithaca Ave
- 15 Signal Ave
- 13 Morris Place
- 57 Bridgewaters Dr Unit 21
- 580 Patten Ave Unit 47
- 580 Patten Ave Unit 48
- 580 Patten Ave Unit 86
- 24 Baruch Dr
- 16 Haskell Way
- 222 Coleman Ave
- 13 Bayview Ct
- 238 Branchport Ave
- 16 Shore Dr
- 177 Kingsley St
- 165 Kingsley St
- 5 Main St
- 165 Riddle Ave Unit 7
- 173 Monmouth Blvd
- 185 Monmouth Blvd
- 167 Monmouth Blvd
- 165 Monmouth Blvd
- 187 Monmouth Blvd
- 163 Monmouth Blvd
- 572 Shrewsbury Ave
- 170 Monmouth Blvd
- 161 Monmouth Blvd
- 188 Monmouth Blvd
- 568 Shrewsbury Ave
- 190 Monmouth Blvd
- 189 Monmouth Blvd
- 166 Monmouth Blvd
- 135 Sagamore Ave
- 192 Monmouth Blvd
- 560 Shrewsbury Ave
- 162 Monmouth Blvd
- 569 Onondaga Ave
- 2 Blue Point Cove