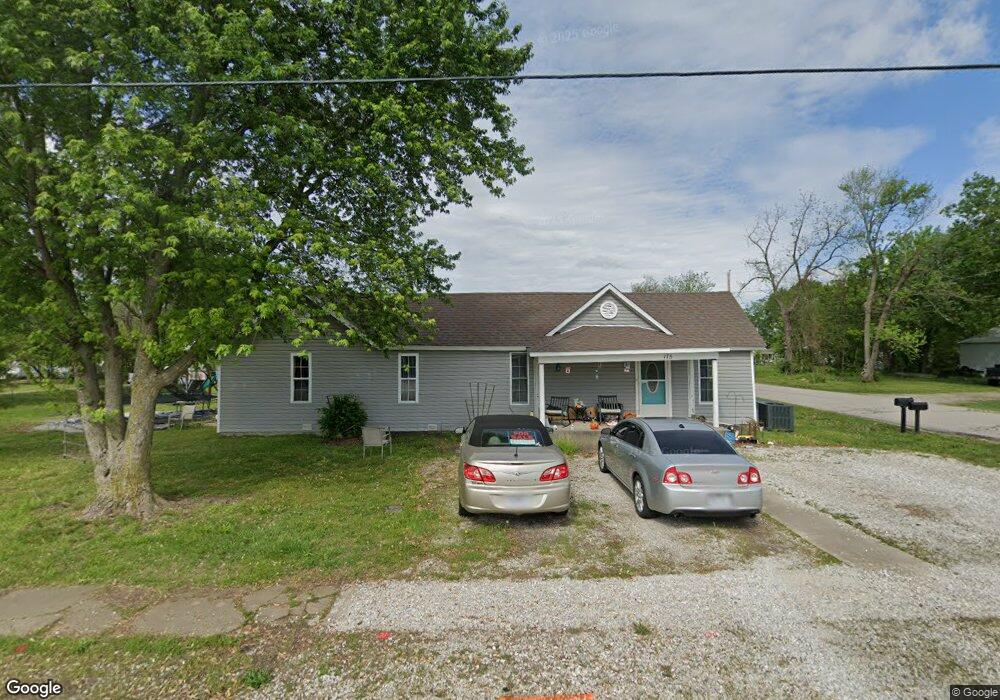
175 N Grant St Oronogo, MO 64855
Estimated Value: $114,000 - $228,000
4
Beds
2
Baths
1,650
Sq Ft
$105/Sq Ft
Est. Value
About This Home
This home is located at 175 N Grant St, Oronogo, MO 64855 and is currently estimated at $172,639, approximately $104 per square foot. 175 N Grant St is a home located in Jasper County with nearby schools including Webb City High School.
Ownership History
Date
Name
Owned For
Owner Type
Purchase Details
Closed on
Mar 11, 2011
Sold by
Koelling Kathleen and Koelling Robert C
Bought by
Forcum Kevin and Forcum Vanessa
Current Estimated Value
Home Financials for this Owner
Home Financials are based on the most recent Mortgage that was taken out on this home.
Original Mortgage
$69,949
Outstanding Balance
$47,864
Interest Rate
4.78%
Mortgage Type
FHA
Estimated Equity
$124,775
Purchase Details
Closed on
Aug 26, 2010
Sold by
Hsbc Mortgage Services Inc
Bought by
Koelling Kathleen
Purchase Details
Closed on
Jul 23, 2010
Sold by
Hubbs Lee W and Hubbs Melissa L
Bought by
Hsbc Mortgage Services Inc
Purchase Details
Closed on
Oct 14, 2005
Sold by
Hubbs Lee W and Hubbs Melissa L
Bought by
Hubbs Lee W and Hubbs Melissa L
Home Financials for this Owner
Home Financials are based on the most recent Mortgage that was taken out on this home.
Original Mortgage
$66,500
Interest Rate
5.92%
Mortgage Type
Stand Alone Refi Refinance Of Original Loan
Create a Home Valuation Report for This Property
The Home Valuation Report is an in-depth analysis detailing your home's value as well as a comparison with similar homes in the area
Home Values in the Area
Average Home Value in this Area
Purchase History
We collect this data history from publicly available records. To have your information removed, we recommend requesting removal directly through your county’s website.
| Date | Buyer | Sale Price | Title Company |
|---|---|---|---|
| Forcum Kevin | -- | None Available | |
| Koelling Kathleen | $20,000 | None Available | |
| Hsbc Mortgage Services Inc | $15,000 | None Available | |
| Hubbs Lee W | -- | -- |
Source: Public Records
Mortgage History
We collect this data history from publicly available records. To have your information removed, we recommend requesting removal directly through your county’s website.
| Date | Status | Borrower | Loan Amount |
|---|---|---|---|
| Open | Forcum Kevin | $69,949 | |
| Previous Owner | Hubbs Lee W | $66,500 |
Source: Public Records
Tax History
| Year | Tax Paid | Tax Assessment Tax Assessment Total Assessment is a certain percentage of the fair market value that is determined by local assessors to be the total taxable value of land and additions on the property. | Land | Improvement |
|---|---|---|---|---|
| 2025 | $660 | $14,440 | $930 | $13,510 |
| 2024 | $661 | $12,720 | $930 | $11,790 |
| 2023 | $661 | $12,720 | $930 | $11,790 |
| 2022 | $644 | $12,430 | $930 | $11,500 |
| 2021 | $640 | $12,430 | $930 | $11,500 |
| 2020 | $565 | $11,440 | $930 | $10,510 |
| 2019 | $566 | $11,440 | $930 | $10,510 |
| 2018 | $551 | $11,160 | $0 | $0 |
| 2017 | $553 | $11,160 | $0 | $0 |
| 2016 | $338 | $7,320 | $0 | $0 |
| 2015 | -- | $7,320 | $0 | $0 |
| 2014 | -- | $7,320 | $0 | $0 |
Source: Public Records
Map
Nearby Homes
- 297 N Davis St
- 908 Gregory Dr
- TBD Tiffney Dr
- 104 Katey Ln
- 116 Katey Ln
- 499 W Amber Dr
- 920 Caitlan Dr
- 269 S 3rd St
- 297 S 4th St
- 321 S 4th St
- TBD 3 87 Acres County Lane 228
- 000 State Highway 96
- 9125 County Lane 217
- 617 Sarah Ct
- 901 D Hwy
- Xxx E Ivy Rd
- 9945 County Lane 217
- 103 Jared Blvd
- 120 Jared Blvd
- 339 Sidney Ln
Your Personal Tour Guide
Ask me questions while you tour the home.