175 N Lee St Markle, IN 46770
Estimated Value: $157,000 - $197,000
3
Beds
2
Baths
2,040
Sq Ft
$83/Sq Ft
Est. Value
About This Home
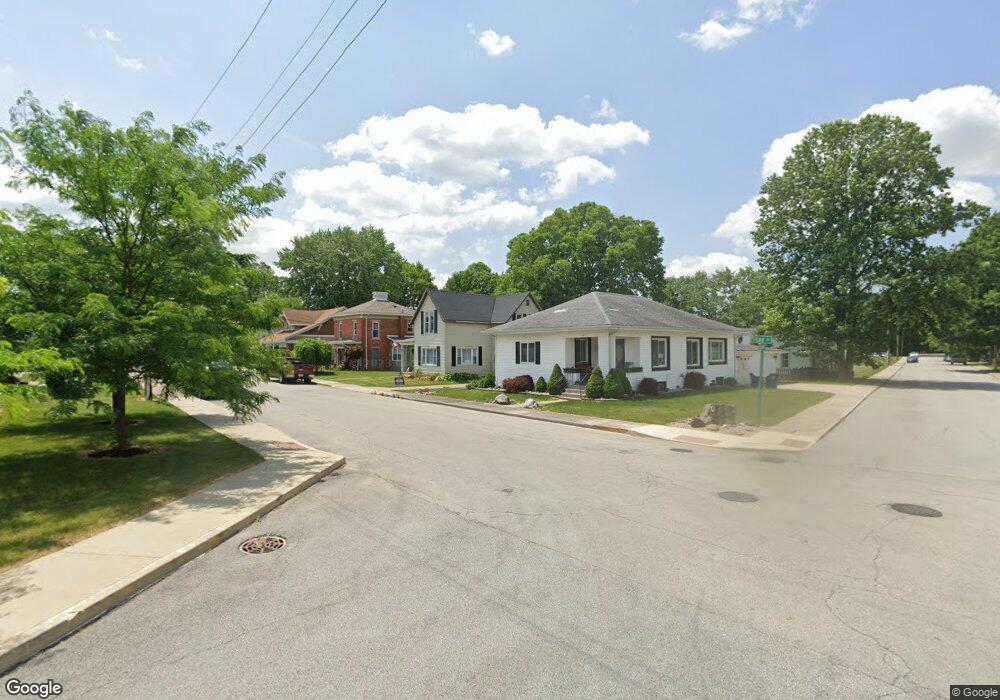
This home is located at 175 N Lee St, Markle, IN 46770 and is currently estimated at $168,870, approximately $82 per square foot. 175 N Lee St is a home located in Huntington County with nearby schools including Salamonie School and Huntington North High School.
Ownership History
Date
Name
Owned For
Owner Type
Purchase Details
Closed on
Jun 29, 2016
Sold by
Allen Peter J
Bought by
Florey Evan Renee
Current Estimated Value
Purchase Details
Closed on
Sep 7, 2007
Sold by
Bowman Jeromy E and Bowman Kristin M
Bought by
Allen Peter J
Home Financials for this Owner
Home Financials are based on the most recent Mortgage that was taken out on this home.
Original Mortgage
$61,000
Interest Rate
6.72%
Mortgage Type
New Conventional
Create a Home Valuation Report for This Property
The Home Valuation Report is an in-depth analysis detailing your home's value as well as a comparison with similar homes in the area
Purchase History
| Date | Buyer | Sale Price | Title Company |
|---|---|---|---|
| Florey Evan Renee | $89,900 | -- | |
| Allen Peter J | -- | None Available |
Source: Public Records
Mortgage History
| Date | Status | Borrower | Loan Amount |
|---|---|---|---|
| Previous Owner | Allen Peter J | $61,000 |
Source: Public Records
Tax History
| Year | Tax Paid | Tax Assessment Tax Assessment Total Assessment is a certain percentage of the fair market value that is determined by local assessors to be the total taxable value of land and additions on the property. | Land | Improvement |
|---|---|---|---|---|
| 2024 | $1,361 | $136,100 | $7,600 | $128,500 |
| 2023 | $1,170 | $118,300 | $7,600 | $110,700 |
| 2022 | $978 | $109,200 | $7,600 | $101,600 |
| 2021 | $1,084 | $108,900 | $7,600 | $101,300 |
| 2020 | $912 | $97,600 | $7,600 | $90,000 |
| 2019 | $832 | $95,400 | $7,600 | $87,800 |
| 2018 | $923 | $95,500 | $7,600 | $87,900 |
| 2017 | $455 | $70,700 | $7,600 | $63,100 |
| 2016 | $373 | $67,700 | $7,600 | $60,100 |
| 2014 | $429 | $64,000 | $7,600 | $56,400 |
| 2013 | $429 | $65,200 | $7,600 | $57,600 |
Source: Public Records
Map
Nearby Homes
Your Personal Tour Guide
Ask me questions while you tour the home.