175 N Main St Lakeport, CA 95453
Estimated Value: $533,269
About This Home
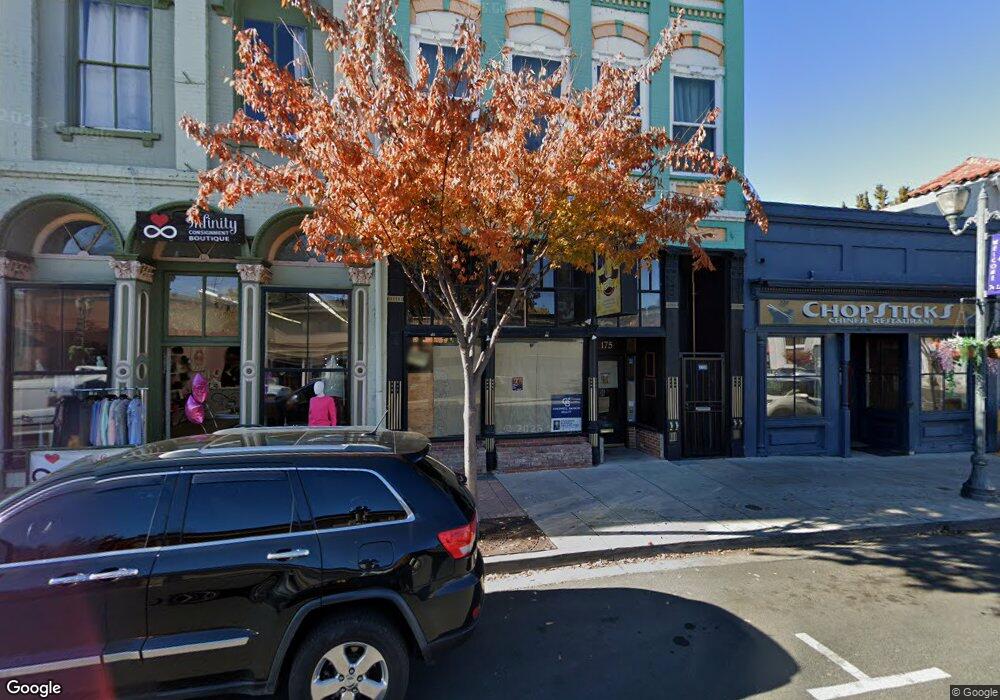
This home is located at 175 N Main St, Lakeport, CA 95453 and is currently estimated at $533,269, approximately $453 per square foot. 175 N Main St is a home located in Lake County with nearby schools including Lakeport Elementary School, Terrace Middle School, and Clear Lake High School.
Ownership History
We collect this data history from publicly available records. To have your information removed, we recommend requesting removal directly through your county’s website.
Purchase Details
Purchase Details
Home Financials for this Owner
Home Financials are based on the most recent Mortgage that was taken out on this home.Purchase Details
Home Values in the Area
Average Home Value in this Area
Purchase History
We collect this data history from publicly available records. To have your information removed, we recommend requesting removal directly through your county’s website.
| Date | Buyer | Sale Price | Title Company |
|---|---|---|---|
| $476,412 | None Available | ||
| $460,000 | None Available | ||
| $330,000 | First American Title |
Mortgage History
We collect this data history from publicly available records. To have your information removed, we recommend requesting removal directly through your county’s website.
| Date | Status | Borrower | Loan Amount |
|---|---|---|---|
| Previous Owner | $460,000 |
Tax History
We collect this data history from publicly available records. To have your information removed, we recommend requesting removal directly through your county’s website.
| Year | Tax Paid | Tax Assessment Tax Assessment Total Assessment is a certain percentage of the fair market value that is determined by local assessors to be the total taxable value of land and additions on the property. | Land | Improvement |
|---|---|---|---|---|
| 2025 | $4,665 | $368,117 | $55,774 | $312,343 |
| 2024 | $4,548 | $360,900 | $54,681 | $306,219 |
| 2023 | $4,462 | $353,824 | $53,609 | $300,215 |
| 2022 | $4,380 | $346,887 | $52,558 | $294,329 |
| 2021 | $4,339 | $340,086 | $51,528 | $288,558 |
| 2020 | $4,208 | $336,600 | $51,000 | $285,600 |
| 2019 | $4,585 | $365,000 | $50,000 | $315,000 |
Map
- 302 N Main St
- 130 Armstrong St
- 220 4th St
- 360 3rd St
- 455 N Forbes St
- 320 Armstrong St
- 225 N Tunis St
- 560 1st St
- 825 N Forbes St
- 50 E St
- 140 S Starr St
- 777 Seventh St
- 521 10th St
- 1095 N Main St
- 65 Lily Cove Ave
- 110 S Russell St
- 1025 Martin St Unit 2
- 1025 Martin St Unit 10
- 1025 Martin St Unit 20
- 1025 Martin St Unit 13
Ask me questions while you tour the home.