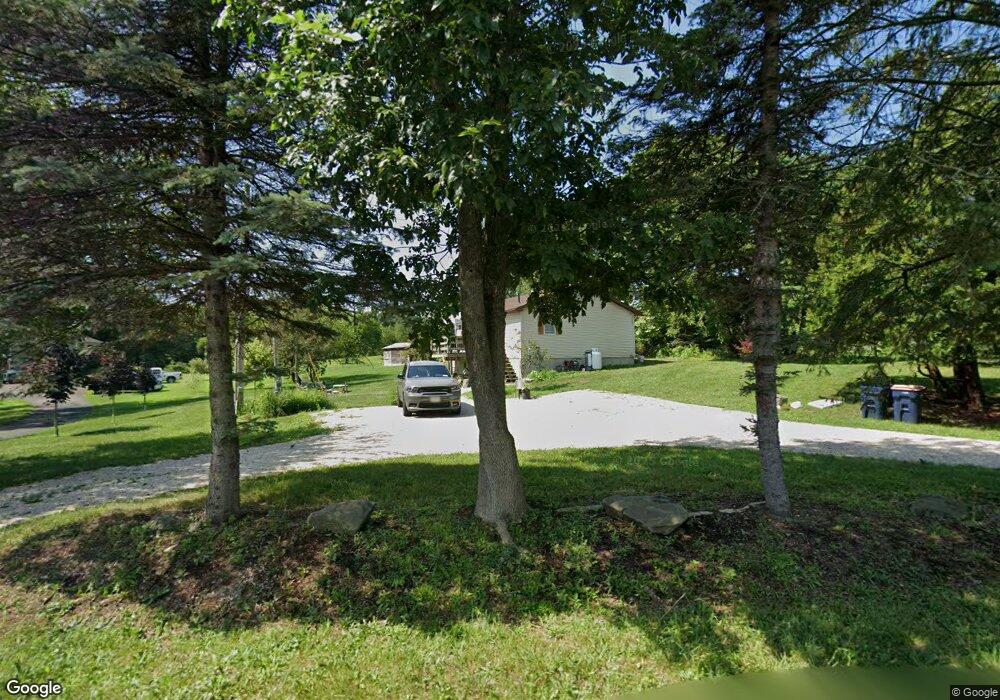
175 Nevis Rd Tivoli, NY 12583
Estimated Value: $326,000 - $434,000
3
Beds
3
Baths
1,056
Sq Ft
$360/Sq Ft
Est. Value
About This Home
This home is located at 175 Nevis Rd, Tivoli, NY 12583 and is currently estimated at $380,368, approximately $360 per square foot. 175 Nevis Rd is a home located in Columbia County with nearby schools including Mill Road Primary School, Mill Road Intermediate School, and Linden Avenue Middle School.
Ownership History
Date
Name
Owned For
Owner Type
Purchase Details
Closed on
Aug 9, 2019
Sold by
Briggs Matthew G
Bought by
Briggs Kyle
Current Estimated Value
Home Financials for this Owner
Home Financials are based on the most recent Mortgage that was taken out on this home.
Original Mortgage
$165,200
Outstanding Balance
$144,685
Interest Rate
3.7%
Mortgage Type
New Conventional
Estimated Equity
$235,683
Purchase Details
Closed on
May 17, 2016
Sold by
Federal National Mortgage Association
Bought by
Brigs Matthew G
Purchase Details
Closed on
May 5, 2015
Sold by
Siegel Regina Sophia
Bought by
Federal National Mortgage Association
Purchase Details
Closed on
Jun 19, 2003
Sold by
Est Taylro Joan K
Bought by
Siegel Regina Sophia
Purchase Details
Closed on
Dec 21, 2001
Sold by
Taylor Joan K
Bought by
Taylor Joan K
Purchase Details
Closed on
Oct 8, 1998
Purchase Details
Closed on
Dec 30, 1996
Sold by
Taylor Joan K
Bought by
Seymour Philip L
Create a Home Valuation Report for This Property
The Home Valuation Report is an in-depth analysis detailing your home's value as well as a comparison with similar homes in the area
Home Values in the Area
Average Home Value in this Area
Purchase History
| Date | Buyer | Sale Price | Title Company |
|---|---|---|---|
| Briggs Kyle | $206,500 | -- | |
| Brigs Matthew G | $132,000 | Jeffrey Martin | |
| Federal National Mortgage Association | -- | -- | |
| Siegel Regina Sophia | $160,000 | Craig Wallace | |
| Taylor Joan K | -- | -- | |
| -- | -- | -- | |
| Seymour Philip L | -- | -- |
Source: Public Records
Mortgage History
| Date | Status | Borrower | Loan Amount |
|---|---|---|---|
| Open | Briggs Kyle | $165,200 |
Source: Public Records
Tax History
| Year | Tax Paid | Tax Assessment Tax Assessment Total Assessment is a certain percentage of the fair market value that is determined by local assessors to be the total taxable value of land and additions on the property. | Land | Improvement |
|---|---|---|---|---|
| 2024 | $6,224 | $305,000 | $113,300 | $191,700 |
| 2023 | $5,353 | $186,000 | $98,940 | $87,060 |
| 2022 | $5,061 | $186,000 | $98,940 | $87,060 |
| 2021 | $4,647 | $155,000 | $98,940 | $56,060 |
| 2020 | $4,580 | $155,000 | $98,940 | $56,060 |
| 2019 | $4,377 | $155,000 | $102,000 | $53,000 |
| 2018 | $4,377 | $140,000 | $95,700 | $44,300 |
| 2017 | $4,356 | $140,000 | $95,700 | $44,300 |
| 2016 | $1,007 | $140,000 | $95,700 | $44,300 |
| 2015 | -- | $210,000 | $95,700 | $114,300 |
| 2014 | -- | $210,000 | $95,700 | $114,300 |
Source: Public Records
Map
Nearby Homes
- 49 Fox Ln
- 238 Lasher Rd
- 1626 Route 9
- 0 County Route 6
- 207 Pleasantvale Rd
- 0 Pleasantvale Rd
- 239 Pleasantvale Rd
- Lot 2 County Route 6
- Lot 3 County Route 6
- Lot 1 County Route 6
- 37 Williams Rd
- 0 South Rd
- 42 Firehouse Rd
- 47 Clay Hill Rd
- 0 E Kerley Corners Rd Unit KEY939271
- 475 E Kerley Corners Rd
- 20 Pine Rd
- 45 Tivoli Gardens
- 70 Shore Dr
- 440 South Rd
Your Personal Tour Guide
Ask me questions while you tour the home.