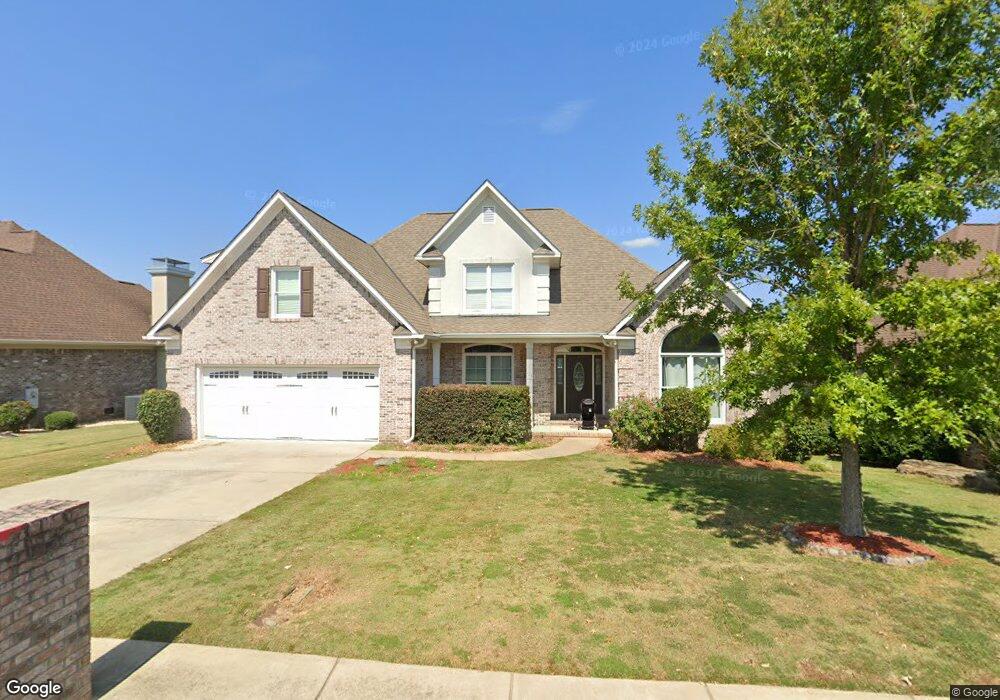
175 Pebblebrook Ln Columbus, GA 31904
North Columbus NeighborhoodEstimated Value: $425,174 - $454,000
4
Beds
3
Baths
2,951
Sq Ft
$149/Sq Ft
Est. Value
About This Home
This home is located at 175 Pebblebrook Ln, Columbus, GA 31904 and is currently estimated at $440,544, approximately $149 per square foot. 175 Pebblebrook Ln is a home located in Muscogee County with nearby schools including Double Churches Elementary School, Double Churches Middle School, and Northside High School.
Ownership History
Date
Name
Owned For
Owner Type
Purchase Details
Closed on
Oct 18, 2019
Sold by
Tith Sophea
Bought by
Tith Sophea and Tith Sopha
Current Estimated Value
Home Financials for this Owner
Home Financials are based on the most recent Mortgage that was taken out on this home.
Original Mortgage
$270,000
Outstanding Balance
$235,792
Interest Rate
3.7%
Mortgage Type
New Conventional
Estimated Equity
$204,752
Purchase Details
Closed on
Mar 29, 2013
Sold by
Jim Mcclung Builder Inc
Bought by
Williams Eric
Home Financials for this Owner
Home Financials are based on the most recent Mortgage that was taken out on this home.
Original Mortgage
$301,342
Interest Rate
3.52%
Mortgage Type
VA
Purchase Details
Closed on
Nov 9, 2011
Sold by
Wwam Inc
Bought by
Jim Mcclung Builder Inc
Create a Home Valuation Report for This Property
The Home Valuation Report is an in-depth analysis detailing your home's value as well as a comparison with similar homes in the area
Home Values in the Area
Average Home Value in this Area
Purchase History
| Date | Buyer | Sale Price | Title Company |
|---|---|---|---|
| Tith Sophea | -- | -- | |
| Tith Sophea | $300,000 | -- | |
| Williams Eric | $295,000 | -- | |
| Jim Mcclung Builder Inc | $56,000 | -- |
Source: Public Records
Mortgage History
| Date | Status | Borrower | Loan Amount |
|---|---|---|---|
| Open | Tith Sophea | $270,000 | |
| Closed | Tith Sophea | $270,000 | |
| Previous Owner | Williams Eric | $301,342 |
Source: Public Records
Tax History
| Year | Tax Paid | Tax Assessment Tax Assessment Total Assessment is a certain percentage of the fair market value that is determined by local assessors to be the total taxable value of land and additions on the property. | Land | Improvement |
|---|---|---|---|---|
| 2025 | $4,181 | $165,916 | $22,008 | $143,908 |
| 2024 | $4,180 | $165,916 | $22,008 | $143,908 |
| 2023 | $3,512 | $165,916 | $22,008 | $143,908 |
| 2022 | $4,360 | $134,368 | $22,008 | $112,360 |
| 2021 | $4,353 | $122,724 | $22,008 | $100,716 |
| 2020 | $4,354 | $120,000 | $21,800 | $98,200 |
| 2019 | $4,955 | $120,932 | $22,008 | $98,924 |
| 2018 | $4,955 | $120,932 | $22,008 | $98,924 |
| 2017 | $4,970 | $120,932 | $22,008 | $98,924 |
| 2016 | $4,868 | $118,000 | $23,200 | $94,800 |
| 2015 | $4,873 | $118,000 | $23,200 | $94,800 |
| 2014 | $4,879 | $118,000 | $23,200 | $94,800 |
| 2013 | -- | $121,679 | $23,200 | $98,479 |
Source: Public Records
Map
Nearby Homes
- 7015 Spring Walk Dr
- 280 Zachary Ct
- 268 Woodstream Dr
- 6801 River Rd Unit 406
- 6801 River Rd Unit 407
- 312 Woodstream Dr
- 308 Woodstream Dr
- 264 Woodstream Dr
- 6861 Copper Oaks Ct
- 6390 Cape Cod Dr
- 6400 Green Island Dr Unit 42
- 6400 Green Island Dr Unit 11
- 6400 Green Island Dr Unit 43
- 7309 Kirkwood Dr
- 7340 Cedar Creek Loop
- 16 Kylemore Ct
- 6333 Cape Cod Dr
- 7192 Village Loop
- 1195 Cloverdale Rd
- 907 Double Churches Rd
- 181 Pebblebrook Ln
- 169 Pebblebrook Ln
- 187 Pebblebrook Ln
- 174 Pebblebrook Ln
- 238 Clearbrook Ln
- 182 Pebblebrook Ln
- 242 Clearbrook Ln
- 168 Pebblebrook Ln
- 234 Clearbrook Ln
- 193 Pebblebrook Ln
- 246 Clearbrook Ln
- 6824 Riverbrook Trace
- 6859 Riverbrook Trace
- 6885 Shadybrook Trail
- 6901 Riverbrook Trace
- 194 Pebblebrook Ln
- 6853 Riverbrook Trace
- 239 Clearbrook Ln
- 243 Clearbrook Ln
- 199 Pebblebrook Ln
Your Personal Tour Guide
Ask me questions while you tour the home.