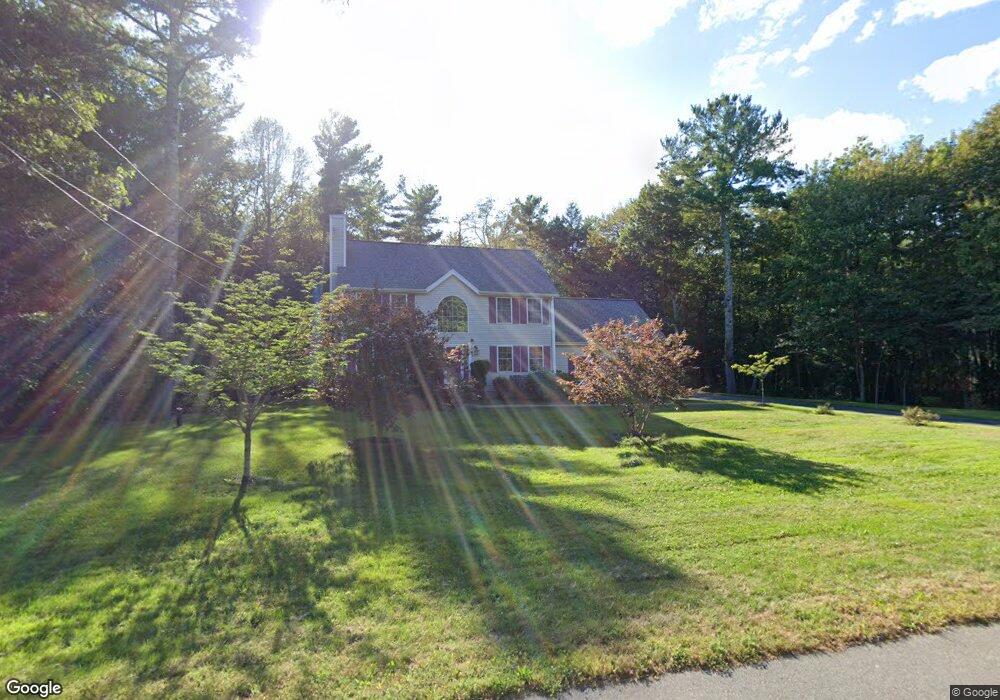
175 Quincy St Holbrook, MA 02343
Estimated Value: $625,000 - $770,000
3
Beds
3
Baths
1,752
Sq Ft
$389/Sq Ft
Est. Value
About This Home
This home is located at 175 Quincy St, Holbrook, MA 02343 and is currently estimated at $681,391, approximately $388 per square foot. 175 Quincy St is a home located in Norfolk County with nearby schools including John F. Kennedy Elementary School, Holbrook Middle High School, and Boston Higashi School.
Ownership History
Date
Name
Owned For
Owner Type
Purchase Details
Closed on
Apr 11, 2006
Sold by
Nguyen Thanh Trang
Bought by
Tran Duy and Nguyen Thanh Trang
Current Estimated Value
Purchase Details
Closed on
Jan 31, 2006
Sold by
Mcbride Ilene M and Mcbride Thomas J
Bought by
Nguyen Thanh Trang
Home Financials for this Owner
Home Financials are based on the most recent Mortgage that was taken out on this home.
Original Mortgage
$354,000
Interest Rate
6.34%
Mortgage Type
Purchase Money Mortgage
Create a Home Valuation Report for This Property
The Home Valuation Report is an in-depth analysis detailing your home's value as well as a comparison with similar homes in the area
Home Values in the Area
Average Home Value in this Area
Purchase History
| Date | Buyer | Sale Price | Title Company |
|---|---|---|---|
| Tran Duy | -- | -- | |
| Nguyen Thanh Trang | $442,500 | -- |
Source: Public Records
Mortgage History
| Date | Status | Borrower | Loan Amount |
|---|---|---|---|
| Previous Owner | Nguyen Thanh Trang | $354,000 | |
| Previous Owner | Nguyen Thanh Trang | $66,375 |
Source: Public Records
Tax History
| Year | Tax Paid | Tax Assessment Tax Assessment Total Assessment is a certain percentage of the fair market value that is determined by local assessors to be the total taxable value of land and additions on the property. | Land | Improvement |
|---|---|---|---|---|
| 2025 | $8,191 | $621,500 | $268,500 | $353,000 |
| 2024 | $7,948 | $591,400 | $244,000 | $347,400 |
| 2023 | $8,119 | $527,900 | $222,500 | $305,400 |
| 2022 | $7,681 | $465,800 | $194,300 | $271,500 |
| 2021 | $7,639 | $443,600 | $182,100 | $261,500 |
| 2020 | $7,862 | $428,000 | $172,500 | $255,500 |
| 2019 | $7,864 | $404,100 | $160,000 | $244,100 |
| 2018 | $7,793 | $377,000 | $138,900 | $238,100 |
| 2017 | $7,691 | $368,000 | $138,900 | $229,100 |
| 2016 | $6,850 | $348,800 | $125,700 | $223,100 |
| 2015 | $6,336 | $332,100 | $120,900 | $211,200 |
| 2014 | $6,085 | $324,200 | $120,900 | $203,300 |
Source: Public Records
Map
Nearby Homes
- 719 S Franklin St Unit C Block 1
- 52 Quincy St
- 660 S Franklin St
- 37 Reeds Ln
- 610 S Franklin St Unit F102
- 275 Jon Dr
- 95 Rindone St
- 14 Leonard Ln
- 12 Hamilton Way
- 36 Kalmia Rd
- 170 Elsie Rd
- 16 Howard Ave
- 244 Hovendon Ave
- 109 Lester Rd
- 19 Rodwell St
- 375 S Franklin St Unit 1
- 88 Roseen Rd
- 717 Hampton Way
- 30 Aspen St
- 133 Ardsley Cir
Your Personal Tour Guide
Ask me questions while you tour the home.