Estimated Value: $269,000 - $306,000
3
Beds
2
Baths
1,272
Sq Ft
$222/Sq Ft
Est. Value
About This Home
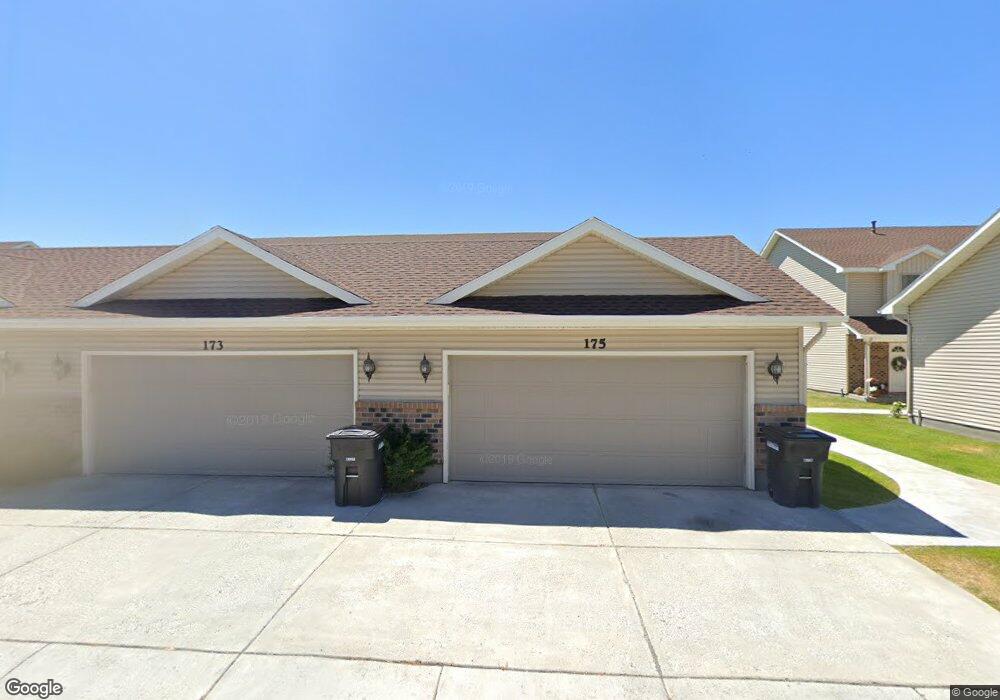
This home is located at 175 Robison Dr Unit 21, Ammon, ID 83406 and is currently estimated at $281,794, approximately $221 per square foot. 175 Robison Dr Unit 21 is a home located in Bonneville County with nearby schools including Hillview Elementary School, Sandcreek Middle School, and Hillcrest High School.
Ownership History
Date
Name
Owned For
Owner Type
Purchase Details
Closed on
Dec 11, 2024
Sold by
Newman Jared J and Newman Rebecca
Bought by
Newman Places Llc
Current Estimated Value
Purchase Details
Closed on
Sep 20, 2020
Sold by
Postma Tim R and Postma June
Bought by
Newman Jared J and Newman Rebecca
Purchase Details
Closed on
Jan 16, 2015
Sold by
Raymond Douglas S and Raymond Joann
Bought by
Postma Tim R and Postma June
Home Financials for this Owner
Home Financials are based on the most recent Mortgage that was taken out on this home.
Original Mortgage
$106,192
Interest Rate
3.82%
Mortgage Type
VA
Purchase Details
Closed on
Mar 6, 2008
Sold by
Centennial Ranch Homes Llc
Bought by
Raymond Douglas S and Raymond Joann
Home Financials for this Owner
Home Financials are based on the most recent Mortgage that was taken out on this home.
Original Mortgage
$91,920
Interest Rate
5.41%
Mortgage Type
New Conventional
Create a Home Valuation Report for This Property
The Home Valuation Report is an in-depth analysis detailing your home's value as well as a comparison with similar homes in the area
Purchase History
| Date | Buyer | Sale Price | Title Company |
|---|---|---|---|
| Newman Places Llc | -- | None Listed On Document | |
| Newman Jared J | -- | Alliance Title | |
| Postma Tim R | -- | Pioneer Title Co | |
| Raymond Douglas S | -- | Idaho Title & Trust Inc |
Source: Public Records
Mortgage History
| Date | Status | Borrower | Loan Amount |
|---|---|---|---|
| Previous Owner | Postma Tim R | $106,192 | |
| Previous Owner | Raymond Douglas S | $91,920 |
Source: Public Records
Tax History
| Year | Tax Paid | Tax Assessment Tax Assessment Total Assessment is a certain percentage of the fair market value that is determined by local assessors to be the total taxable value of land and additions on the property. | Land | Improvement |
|---|---|---|---|---|
| 2025 | $1,674 | $232,396 | $15,628 | $216,768 |
| 2024 | $1,693 | $240,540 | $12,810 | $227,730 |
| 2023 | $1,661 | $232,850 | $12,810 | $220,040 |
| 2022 | $1,702 | $206,625 | $11,585 | $195,040 |
| 2021 | $829 | $138,420 | $10,530 | $127,890 |
| 2019 | $921 | $118,372 | $9,152 | $109,220 |
| 2018 | $848 | $124,238 | $9,338 | $114,900 |
| 2017 | $783 | $110,671 | $7,631 | $103,040 |
| 2016 | $775 | $101,648 | $6,938 | $94,710 |
| 2015 | $734 | $96,588 | $6,938 | $89,650 |
| 2014 | $20,807 | $96,588 | $6,938 | $89,650 |
| 2013 | $1,311 | $93,888 | $6,938 | $86,950 |
Source: Public Records
Map
Nearby Homes
- 171 Robison Dr
- 141 Robison Dr
- 4139 Fairview Dr
- 243 S Bridger Dr
- 250 Butterfly Dr
- 4353 Stubblefield Ct
- 225 Monte Vista Ave
- 265 S Heath Ln
- 169 S Heath Ln
- 660 Butterfly Dr
- 3930 John Adams Pkwy
- 4170 E Spartina
- 596 S Adam Ln
- 820 S Adam Ln
- 978 Edinburg Cir
- 5941 N Freedom Rd
- 3617 E Daleen
- 605 Maurine Dr
- 3823 E Summerridge Cir
- 3838 Summerridge Cir
- 175 Robison Dr
- 173 Robison Dr
- 171 Robison Dr Unit 23
- 179 Robison Dr
- 181 Robison Dr
- 181 Robison Dr
- 183 Robison Dr
- 165 Robison Dr
- 185 Robison Dr
- 163 Robison Dr
- 125 Robison Dr
- 127 Robison Dr
- 123 Robison Dr
- 121 Robison Dr
- 161 Robison Dr
- 131 Robison Dr
- 131 Robison Dr Unit 9
- 4149 Mathews Dr
- 159 Robison Dr
- 189 Robison Dr
Your Personal Tour Guide
Ask me questions while you tour the home.