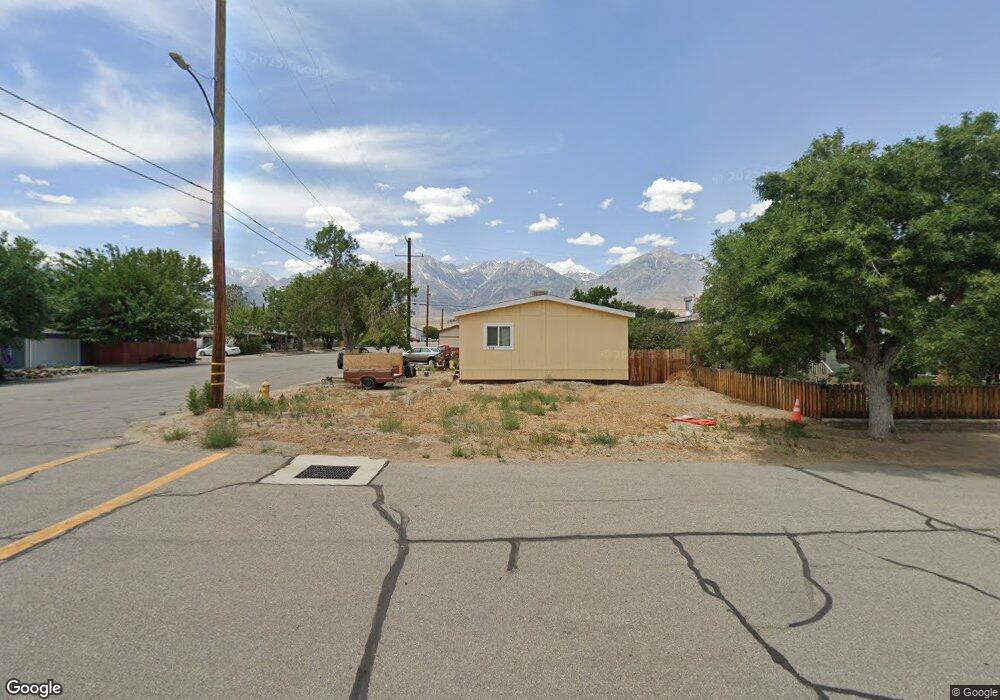
175 S Clay St Independence, CA 93526
Estimated Value: $239,000 - $331,393
4
Beds
2
Baths
1,716
Sq Ft
$164/Sq Ft
Est. Value
About This Home
This home is located at 175 S Clay St, Independence, CA 93526 and is currently estimated at $281,348, approximately $163 per square foot. 175 S Clay St is a home with nearby schools including Owens Valley Elementary School and Owens Valley High School.
Ownership History
Date
Name
Owned For
Owner Type
Purchase Details
Closed on
Sep 9, 2015
Sold by
White Richard A and White Kathleen A
Bought by
Thurman Ronald J
Current Estimated Value
Home Financials for this Owner
Home Financials are based on the most recent Mortgage that was taken out on this home.
Original Mortgage
$80,000
Outstanding Balance
$62,792
Interest Rate
3.89%
Mortgage Type
Seller Take Back
Estimated Equity
$218,556
Purchase Details
Closed on
Feb 13, 2014
Sold by
Templeton Mobile Home Sales
Bought by
White Richard A and White Kathleen A
Create a Home Valuation Report for This Property
The Home Valuation Report is an in-depth analysis detailing your home's value as well as a comparison with similar homes in the area
Purchase History
| Date | Buyer | Sale Price | Title Company |
|---|---|---|---|
| Thurman Ronald J | $100,000 | Mountain Title Company | |
| White Richard A | $30,000 | Mountain Title Company |
Source: Public Records
Mortgage History
| Date | Status | Borrower | Loan Amount |
|---|---|---|---|
| Open | Thurman Ronald J | $80,000 |
Source: Public Records
Tax History
| Year | Tax Paid | Tax Assessment Tax Assessment Total Assessment is a certain percentage of the fair market value that is determined by local assessors to be the total taxable value of land and additions on the property. | Land | Improvement |
|---|---|---|---|---|
| 2025 | $1,573 | $118,372 | $35,511 | $82,861 |
| 2024 | $1,401 | $116,052 | $34,815 | $81,237 |
| 2023 | $1,380 | $113,778 | $34,133 | $79,645 |
| 2022 | $1,326 | $111,548 | $33,464 | $78,084 |
| 2021 | $1,326 | $109,361 | $32,808 | $76,553 |
| 2020 | $1,302 | $108,241 | $32,472 | $75,769 |
| 2019 | $1,302 | $106,120 | $31,836 | $74,284 |
| 2018 | $1,280 | $104,040 | $31,212 | $72,828 |
| 2017 | $1,257 | $102,000 | $30,600 | $71,400 |
| 2016 | $1,233 | $100,000 | $30,000 | $70,000 |
| 2015 | $513 | $30,598 | $25,499 | $5,099 |
| 2014 | $559 | $35,000 | $34,000 | $1,000 |
Source: Public Records
Map
Nearby Homes
- 331 N Jackson St
- 0 Mazourka Canyon Rd Unit 6157615
- 121 E Pangborn St
- 170 Kellogg St
- 106 Kellogg St
- 3780 Whitney Portal Rd
- 1005 Whitney Vista Dr
- 3760 Whitney Portal Rd
- 3580 Whitney Portal Rd
- 1003 Whitney Vista Dr
- 235 N Hay St
- 114 S Hay St
- 0 S of Hwy 190 Unit NS25254867
- 625 E Inyo St
- 0 S Warm Spring Rd Unit FR22152932
- 250 Alabama Dr
- 925 McDonald Rd
- 980 Shahar Ave
- 780 Alabama Dr
- 1985 Indian Springs Dr
- 171 N Clay St
- 215 S Clay St
- 205 S Clay St
- 115 S Clay St
- 200 E Kearsarge St
- 223 S Clay St
- 103 N Clay St
- 229 S Clay St
- 230 S Jackson St Unit 6
- 230 S Jackson St
- 222 S Jackson St
- 241 S Clay St
- 241 S Clay St Unit Lot 10
- 241 N Clay St
- 241 N Clay St Unit Lot 10
- 207 S Jackson St
- 215 S Jackson St
- 215 S Jackson St Unit 2
- 250 S Jackson St
- 137 E Kearsarge St
Your Personal Tour Guide
Ask me questions while you tour the home.