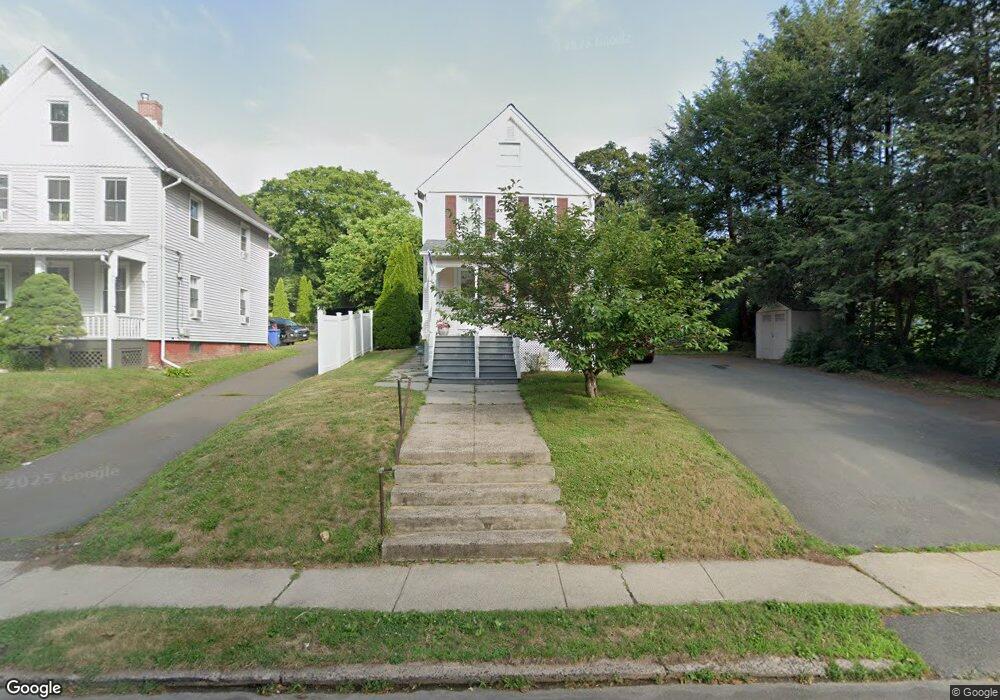
175 S Elm St Wallingford, CT 06492
Estimated Value: $309,011 - $367,000
3
Beds
1
Bath
1,080
Sq Ft
$306/Sq Ft
Est. Value
About This Home
This home is located at 175 S Elm St, Wallingford, CT 06492 and is currently estimated at $331,003, approximately $306 per square foot. 175 S Elm St is a home located in New Haven County with nearby schools including Moses Y Beach Elementary School, Rock Hill Elementary School, and Dag Hammarskjold Middle School.
Ownership History
Date
Name
Owned For
Owner Type
Purchase Details
Closed on
May 31, 2023
Sold by
Oravitz Michael and Oravitz Cynthia
Bought by
Michael and Michael Cynthia Oravitz
Current Estimated Value
Purchase Details
Closed on
Jan 16, 1998
Sold by
Glassman Bruce S and Hughes Tracy
Bought by
Oravitz Michael J and Oravitz Cynthia
Purchase Details
Closed on
Jul 16, 1992
Sold by
Jolly Emma S
Bought by
Atlassman Bruce S and Hughes Tracy
Create a Home Valuation Report for This Property
The Home Valuation Report is an in-depth analysis detailing your home's value as well as a comparison with similar homes in the area
Home Values in the Area
Average Home Value in this Area
Purchase History
| Date | Buyer | Sale Price | Title Company |
|---|---|---|---|
| Michael | -- | None Available | |
| Michael | -- | None Available | |
| Oravitz Michael J | $111,500 | -- | |
| Oravitz Michael J | $111,500 | -- | |
| Atlassman Bruce S | $100,000 | -- |
Source: Public Records
Mortgage History
| Date | Status | Borrower | Loan Amount |
|---|---|---|---|
| Previous Owner | Atlassman Bruce S | $178,470 | |
| Previous Owner | Atlassman Bruce S | $200,000 | |
| Previous Owner | Atlassman Bruce S | $152,000 |
Source: Public Records
Tax History
| Year | Tax Paid | Tax Assessment Tax Assessment Total Assessment is a certain percentage of the fair market value that is determined by local assessors to be the total taxable value of land and additions on the property. | Land | Improvement |
|---|---|---|---|---|
| 2025 | $4,863 | $201,600 | $84,800 | $116,800 |
| 2024 | $4,363 | $142,300 | $74,800 | $67,500 |
| 2023 | $4,175 | $142,300 | $74,800 | $67,500 |
| 2022 | $4,132 | $142,300 | $74,800 | $67,500 |
| 2021 | $4,058 | $142,300 | $74,800 | $67,500 |
| 2020 | $4,218 | $144,500 | $80,200 | $64,300 |
| 2019 | $4,218 | $144,500 | $80,200 | $64,300 |
| 2018 | $4,138 | $144,500 | $80,200 | $64,300 |
| 2017 | $4,125 | $144,500 | $80,200 | $64,300 |
| 2016 | $4,030 | $144,500 | $80,200 | $64,300 |
| 2015 | $3,969 | $144,500 | $80,200 | $64,300 |
| 2014 | $3,886 | $144,500 | $80,200 | $64,300 |
Source: Public Records
Map
Nearby Homes
- 120 S Cherry St
- 42 S Cherry St Unit 238
- 85 N Colony St
- 69 Terrace Gardens
- 46 Walnut Ln
- 57 Terrace Gardens Unit 57
- 70 Putter Dr Unit 211
- 21 Putter Dr Unit 303S
- 16 Putter Dr Unit 207S
- 30 Clinton Place
- 90 Masonic Ave
- 31 S Turnpike Rd Unit C2
- 570 N Main St
- 71 Cedar Ln
- 1 Dean Dr
- 61 Cheshire Rd
- 2 Brentwood Dr Unit 2
- 129 Brentwood Dr
- 3 Spice Hill Dr
- 36R Nod Brook Rd
Your Personal Tour Guide
Ask me questions while you tour the home.