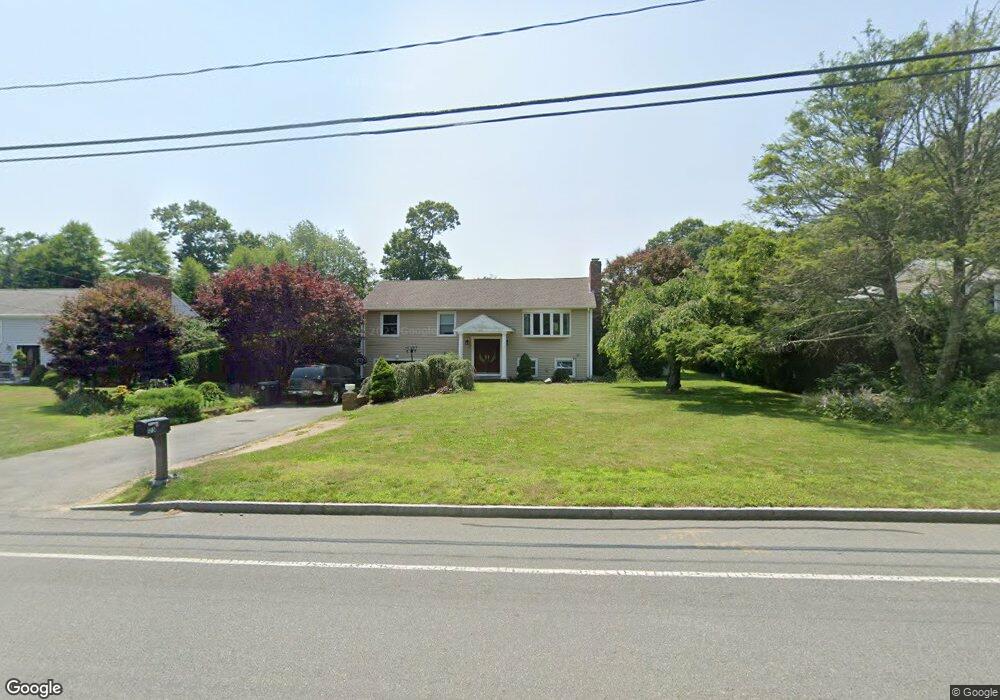
175 Slocum Rd North Dartmouth, MA 02747
North Apponagansett NeighborhoodEstimated Value: $598,000 - $657,000
3
Beds
3
Baths
1,535
Sq Ft
$412/Sq Ft
Est. Value
About This Home
This home is located at 175 Slocum Rd, North Dartmouth, MA 02747 and is currently estimated at $632,412, approximately $411 per square foot. 175 Slocum Rd is a home located in Bristol County with nearby schools including Dartmouth High School, Friends Academy, and Our Sister's School.
Ownership History
Date
Name
Owned For
Owner Type
Purchase Details
Closed on
Apr 13, 2017
Sold by
Ponte Irt
Bought by
Giusti Bryan J and Giusti Rosemarie L
Current Estimated Value
Home Financials for this Owner
Home Financials are based on the most recent Mortgage that was taken out on this home.
Original Mortgage
$328,000
Outstanding Balance
$267,473
Interest Rate
3.5%
Mortgage Type
Adjustable Rate Mortgage/ARM
Estimated Equity
$364,939
Purchase Details
Closed on
Apr 30, 2007
Sold by
Ponte Abel C and Ponte Maria V
Bought by
Ponte Tr Abel C and Ponte Maria
Create a Home Valuation Report for This Property
The Home Valuation Report is an in-depth analysis detailing your home's value as well as a comparison with similar homes in the area
Home Values in the Area
Average Home Value in this Area
Purchase History
| Date | Buyer | Sale Price | Title Company |
|---|---|---|---|
| Giusti Bryan J | $410,000 | -- | |
| Ponte Tr Abel C | -- | -- |
Source: Public Records
Mortgage History
| Date | Status | Borrower | Loan Amount |
|---|---|---|---|
| Open | Giusti Bryan J | $328,000 | |
| Previous Owner | Ponte Tr Abel C | $39,500 | |
| Previous Owner | Ponte Tr Abel C | $10,000 | |
| Previous Owner | Ponte Tr Abel C | $5,000 |
Source: Public Records
Tax History Compared to Growth
Tax History
| Year | Tax Paid | Tax Assessment Tax Assessment Total Assessment is a certain percentage of the fair market value that is determined by local assessors to be the total taxable value of land and additions on the property. | Land | Improvement |
|---|---|---|---|---|
| 2025 | $4,483 | $520,700 | $173,200 | $347,500 |
| 2024 | $4,347 | $500,200 | $165,200 | $335,000 |
| 2023 | $4,106 | $447,800 | $153,200 | $294,600 |
| 2022 | $4,069 | $411,000 | $146,600 | $264,400 |
| 2021 | $3,926 | $379,000 | $129,400 | $249,600 |
| 2020 | $3,824 | $368,400 | $129,400 | $239,000 |
| 2019 | $3,697 | $355,500 | $129,400 | $226,100 |
| 2018 | $3,375 | $333,800 | $129,400 | $204,400 |
| 2017 | $3,299 | $329,200 | $122,100 | $207,100 |
| 2016 | $3,222 | $317,100 | $122,100 | $195,000 |
| 2015 | $3,046 | $300,400 | $114,100 | $186,300 |
| 2014 | $2,919 | $285,900 | $103,500 | $182,400 |
Source: Public Records
Map
Nearby Homes
- 33 Rosewood Terrace
- 29 Elizabeth Ct
- 6 Jacob Dr
- 25 Westwood Dr
- 6 Walters Way
- 5 Samosett Dr
- 98 Mccabe St
- 3 Mishawum Dr
- 0 Victoria St Unit 73457953
- 44 Arrowhead Ln
- 212 Rockland St
- 360 Russells Mills Rd
- 729 Allen St
- 32 Fulton St
- 6 Strathmore Rd
- 21 Avis St
- 49 Stackhouse St
- 511 Bedford St
- 24 Wayne Memorial Dr
- 10 Westview Dr