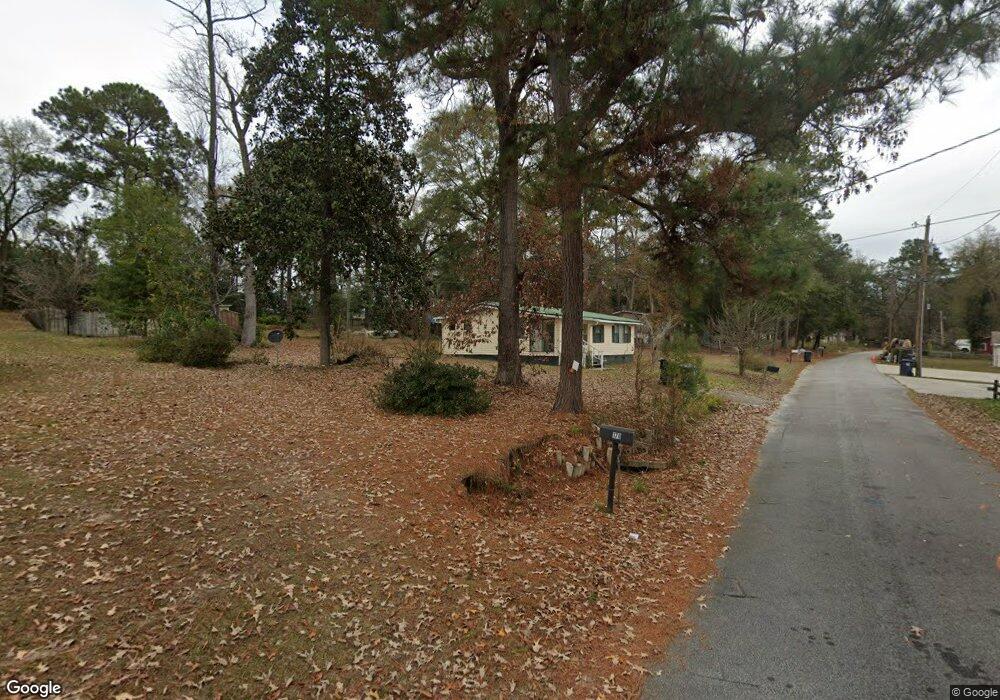
175 Swift Creek Rd Cordele, GA 31015
Estimated Value: $103,925 - $160,000
2
Beds
2
Baths
985
Sq Ft
$130/Sq Ft
Est. Value
About This Home
This home is located at 175 Swift Creek Rd, Cordele, GA 31015 and is currently estimated at $128,231, approximately $130 per square foot. 175 Swift Creek Rd is a home located in Crisp County with nearby schools including Crisp County Elementary School, Crisp County Primary School, and Crisp County Middle School.
Ownership History
Date
Name
Owned For
Owner Type
Purchase Details
Closed on
Apr 22, 2010
Sold by
Bullard Stanley T
Bought by
Bullard Stanley T and Bullard Marie B
Current Estimated Value
Home Financials for this Owner
Home Financials are based on the most recent Mortgage that was taken out on this home.
Original Mortgage
$75,000
Outstanding Balance
$73,087
Interest Rate
4.99%
Mortgage Type
Reverse Mortgage Home Equity Conversion Mortgage
Estimated Equity
$55,145
Purchase Details
Closed on
Dec 30, 2002
Sold by
Hunter Joey Holeman
Bought by
Bullard Stanley T
Purchase Details
Closed on
Nov 28, 2001
Sold by
Bullard Stanley
Bought by
Hunter Joey Holeman
Purchase Details
Closed on
Jan 29, 1998
Sold by
Bullard Marie
Bought by
Bullard Stanley
Purchase Details
Closed on
Oct 28, 1992
Sold by
Bullard Stanley Eta
Bought by
Bullard Marie
Purchase Details
Closed on
Jan 26, 1982
Bought by
Bullard Stanley Eta
Create a Home Valuation Report for This Property
The Home Valuation Report is an in-depth analysis detailing your home's value as well as a comparison with similar homes in the area
Home Values in the Area
Average Home Value in this Area
Purchase History
| Date | Buyer | Sale Price | Title Company |
|---|---|---|---|
| Bullard Stanley T | -- | -- | |
| Bullard Stanley T | -- | -- | |
| Hunter Joey Holeman | -- | -- | |
| Bullard Stanley | -- | -- | |
| Bullard Marie | -- | -- | |
| Bullard Stanley Eta | -- | -- |
Source: Public Records
Mortgage History
| Date | Status | Borrower | Loan Amount |
|---|---|---|---|
| Open | Bullard Stanley T | $75,000 |
Source: Public Records
Tax History Compared to Growth
Tax History
| Year | Tax Paid | Tax Assessment Tax Assessment Total Assessment is a certain percentage of the fair market value that is determined by local assessors to be the total taxable value of land and additions on the property. | Land | Improvement |
|---|---|---|---|---|
| 2024 | $592 | $21,861 | $4,732 | $17,129 |
| 2023 | $568 | $20,217 | $4,732 | $15,485 |
| 2022 | $524 | $18,649 | $2,603 | $16,046 |
| 2021 | $469 | $15,802 | $2,603 | $13,199 |
| 2020 | $68 | $15,204 | $2,220 | $12,984 |
| 2019 | $67 | $15,204 | $2,220 | $12,984 |
| 2018 | $142 | $20,317 | $5,204 | $15,113 |
| 2017 | $625 | $20,317 | $5,204 | $15,113 |
| 2016 | $104 | $17,854 | $5,204 | $12,650 |
| 2015 | -- | $17,854 | $5,204 | $12,650 |
| 2014 | -- | $17,854 | $5,204 | $12,650 |
| 2013 | -- | $17,853 | $5,204 | $12,649 |
Source: Public Records
Map
Nearby Homes
- 144 Bryant Rd
- 198 Swift Creek Rd
- 118 Swift Creek Rd
- 102 Perch Dr
- 000 Bream Rd
- 0 Swift Creek Rd Unit 138425
- 0 Arabi Warwick Rd
- 130 Swift Creek Rd
- 000 Swift Creek Rd
- 317 Mill Branch Rd
- 303 Mill Branch Rd
- 199 Hurt Dr
- 620 Lakeshore Dr
- 0 Washington St SE
- 484 Spring Creek Rd
- 636 Spring Creek Rd
- Lot 15 Georgia-Florida Pkwy
- 129 Main St NW
- 480 Spring Creek Rd
- 0 Power Dam Rd
- 177 Swift Creek Rd
- 138 Bryant Rd
- 181 Swift Creek Rd
- 163 Swift Creek Rd
- 176 Swift Creek Rd
- 170 Swift Creek Rd
- 166 Swift Creek Rd
- 155 Bryant Rd
- 184 Swift Creek Rd
- 179 Bryant Rd
- 179 Bryant Rd
- 162 Swift Creek Rd
- 186 Swift Creek Rd
- 164 Swift Creek Rd
- 190 Swift Creek Rd
- 191 Swift Creek Rd
- 158 Swift Creek Rd
- 155 Swift Creek Rd
- 154 Swift Creek Rd
- 151 Swift Creek Rd