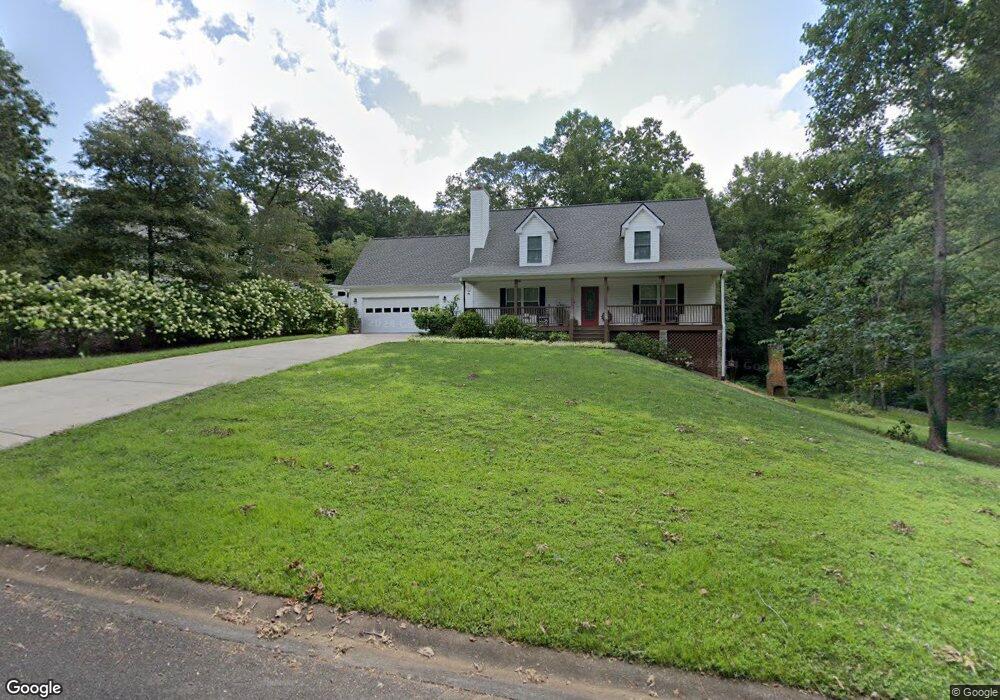
175 Tilly Farm Rd Unit 24 Ellijay, GA 30540
Estimated Value: $440,000 - $569,000
3
Beds
3
Baths
2,461
Sq Ft
$200/Sq Ft
Est. Value
About This Home
This home is located at 175 Tilly Farm Rd Unit 24, Ellijay, GA 30540 and is currently estimated at $491,701, approximately $199 per square foot. 175 Tilly Farm Rd Unit 24 is a home located in Gilmer County with nearby schools including Ellijay Elementary School, Clear Creek Elementary School, and Clear Creek Middle School.
Ownership History
Date
Name
Owned For
Owner Type
Purchase Details
Closed on
Mar 22, 2012
Sold by
Community & Southern Bank
Bought by
Winn Kimberly
Current Estimated Value
Home Financials for this Owner
Home Financials are based on the most recent Mortgage that was taken out on this home.
Original Mortgage
$142,857
Outstanding Balance
$98,600
Interest Rate
3.97%
Mortgage Type
New Conventional
Estimated Equity
$393,101
Purchase Details
Closed on
Aug 2, 2011
Sold by
Lanier Corey and Lanier Monica
Bought by
Community & Southern Bank
Purchase Details
Closed on
Oct 3, 2008
Sold by
Wci Properties Inc
Bought by
Lanier Corey
Purchase Details
Closed on
Feb 9, 2007
Sold by
Old South Developers Llc
Bought by
Wci Properties Inc
Purchase Details
Closed on
Aug 27, 2004
Sold by
Jones Brenda B
Bought by
Old South Developers Llc
Create a Home Valuation Report for This Property
The Home Valuation Report is an in-depth analysis detailing your home's value as well as a comparison with similar homes in the area
Home Values in the Area
Average Home Value in this Area
Purchase History
| Date | Buyer | Sale Price | Title Company |
|---|---|---|---|
| Winn Kimberly | $140,000 | -- | |
| Community & Southern Bank | $156,000 | -- | |
| Lanier Corey | $247,000 | -- | |
| Wci Properties Inc | $1,330,000 | -- | |
| Old South Developers Llc | -- | -- |
Source: Public Records
Mortgage History
| Date | Status | Borrower | Loan Amount |
|---|---|---|---|
| Open | Winn Kimberly | $142,857 |
Source: Public Records
Tax History Compared to Growth
Tax History
| Year | Tax Paid | Tax Assessment Tax Assessment Total Assessment is a certain percentage of the fair market value that is determined by local assessors to be the total taxable value of land and additions on the property. | Land | Improvement |
|---|---|---|---|---|
| 2024 | $2,123 | $183,280 | $10,800 | $172,480 |
| 2023 | $2,167 | $180,480 | $8,000 | $172,480 |
| 2022 | $2,019 | $143,840 | $8,000 | $135,840 |
| 2021 | $2,193 | $136,840 | $12,000 | $124,840 |
| 2020 | $1,928 | $101,000 | $6,000 | $95,000 |
| 2019 | $1,982 | $101,000 | $6,000 | $95,000 |
| 2018 | $2,130 | $101,000 | $6,000 | $95,000 |
| 2017 | $1,927 | $80,200 | $4,000 | $76,200 |
| 2016 | $1,987 | $81,040 | $4,000 | $77,040 |
| 2015 | $1,716 | $84,200 | $4,000 | $80,200 |
| 2014 | $1,541 | $64,920 | $4,000 | $60,920 |
| 2013 | -- | $66,720 | $4,000 | $62,720 |
Source: Public Records
Map
Nearby Homes
- 100 Carters View Dr
- 248 Tilly Farm Rd
- 650 Wingate Rd
- 953 Round Top Rd
- 957 Round Top Rd
- 385 Lakeside Park Dr
- 8 Linda Ln
- 756 Linger Longer Dr
- 619 Linger Longer Dr
- 562 Linger Longer Dr
- 375 Linger Longer Dr
- 177 Creekside Landing
- Lt 291 Creekside Trail
- 351 Creekside Dr
- 2 Round Top Rd
- 1 Round Top Rd
- 145 Knight Rd
- 301 Willow Oak Trail
- 82 Orman Dr
- 175 Tilly Farm Rd
- 145 Tilly Farm Rd Unit 23
- 145 Tilly Farm Rd
- 104 Carters View Dr
- 104 Carters View Dr
- LT 113 Tranquility
- LT 113 Tranquility @ Carters
- 115 Tilly Farm Rd Unit 22
- 115 Tilly Farm Rd
- 142 Tilly Farm Rd
- 172 Tilly Farm Rd
- 85 Tilly Farm Rd
- 128 Tilly Farm Rd
- 152 Tilly Farm Rd
- 238 Tilly Farm Rd
- 238 Tilly Farm Rd
- 118 Tilly Farm Rd
- 67 Tilly Farm Rd
- 104 Tilly Farm Rd
- 28 Tilly Ct