NOT LISTED FOR SALE

175 Tucker Ave Norwalk, OH 44857

Estimated Value: $183,000 - $215,000

3 Beds
1.5 Baths
1,338 Sq Ft
$147/Sq Ft Est. Value

Last Sold October 20, 2022

Last sale price $155,000 $116 Per Sq Ft

Est. 27% increase in value since last sale

Current estimated payment $1,218/month

67 Days on Market

Highlights

  • 2 Car Direct Access Garage
  • Living Room
  • 1-Story Property
  • Thermal Pane Windows
  • Laundry Room
  • Forced Air Heating and Cooling System

About This Home

As of October 2022

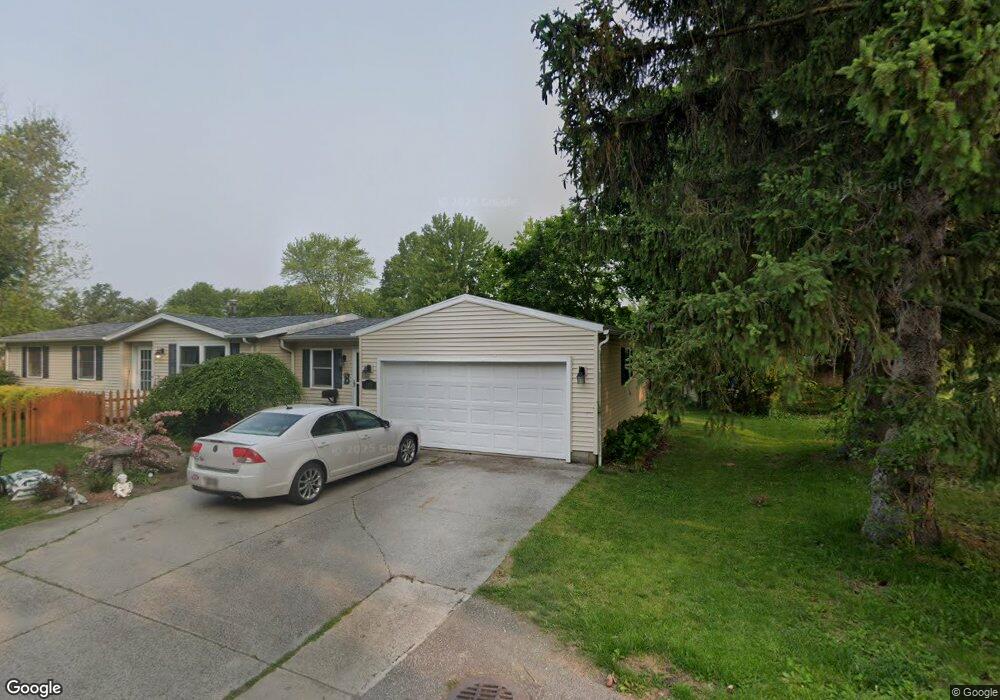
Ranch style 3 bedroom home located 2 blocks from Maplehurst Grade School. Double lot totaling almost .5 acre, 2 car attached garage. Low maintenance vinyl siding exterior. Storage shed included.OPEN HOUSESAT. SEPT 24, 202212:00 NOON - 1:30 PM

Last Agent to Sell the Property

Jay Ewell

Ewell & Associates License #258182 Listed on: 08/13/2022

Co-Listed By

Default zSystem

zSystem Default

Last Buyer's Agent

Joseph Bibb

Bibb Realty License #000212860

Home Details

Home Type

  • Single Family

Est. Annual Taxes

  • $1,692

Year Built

  • Built in 1971

Lot Details

  • 0.46 Acre Lot
  • Lot Dimensions are 120' x 150'
  • Additional Parcels

Parking

  • 2 Car Direct Access Garage
  • Garage Door Opener
  • Open Parking
  • Off-Street Parking

Home Design

  • Asphalt Roof
  • Vinyl Siding

Interior Spaces

  • 1,338 Sq Ft Home
  • 1-Story Property
  • Thermal Pane Windows
  • Family Room
  • Living Room
  • Crawl Space
  • Laundry Room

Kitchen

  • Range
  • Microwave
  • Dishwasher

Bedrooms and Bathrooms

  • 3 Bedrooms

Utilities

  • Forced Air Heating and Cooling System
  • Heating System Uses Natural Gas
  • 200+ Amp Service
  • Cable TV Available

Community Details

  • City/Norwalk Subdivision

Listing and Financial Details

  • Assessor Parcel Number 330350050590000

Home Details

Home Type

Single Family

Est. Annual Taxes

$1,692

Year Built

Built in 1971

Lot Details

0

Parking

2

Listing Details

  • PropertySubType: Single Family Residence
  • PropertyType: Residential
  • LaundryFeatures: Laundry Room
  • Lot Size Acres: 0.46
  • NAV29_Unit_1_Appliances: Dishwasher, Microwave, Range, Refrigerator
  • MLS Status: Sold
  • Subdivision Name: City/Norwalk
  • Directions: St Marys St to Central Blvd. to west on Tucker St. last house on right.
  • ResoBuildingAreaSource: Public Records
  • Carport Y N: No
  • Unit Levels: One
  • Living Area: 1338
  • Property Attached Yn: No
  • Roof: Asphalt
  • Window Features: Thermo Pane
  • Year Built: 1971
  • Tax Year: 2021
  • Master Plan Zoning: R-1
  • Financial Info Electric: 200+ Amp Service
  • ResoBuildingAreaSource: PublicRecords
  • Kitchen Level: Main
  • Special Features: None
  • Property Sub Type: Detached
  • Stories: 0

Interior Features

  • Full Bathrooms: 1
  • Half Bathrooms: 1
  • Total Bedrooms: 3
  • Main Level Bathrooms: 2
  • ResoLivingAreaSource: PublicRecords
  • Dining Room Features: Combo
  • Living Room Living Room Level: Main
  • Master Bedroom Master Bedroom Level: Main
  • Room Bedroom3 Level: Main
  • Room Family Room Area: 231
  • Room Bedroom2 Level: Main
  • Room Family Room Level: Main

Exterior Features

  • View: No
  • Waterfront: No
  • Home Warranty: No
  • Construction Type: Vinyl Siding
  • Foundation Details: Crawl Space
  • Patio And Porch Features: Wood Deck

Garage/Parking

  • Attached Garage: Yes
  • Covered Parking Spaces: 2
  • Garage Spaces: 2
  • Attached Garage: Yes
  • Open Parking: Yes
  • Parking Features: Access from Unit, Attached, Garage Door Opener, Off Street, Paved
  • Total Parking Spaces: 2

Utilities

  • Cooling: Central Air
  • Cooling Y N: Yes
  • Heating: Natural Gas, Forced Air
  • HeatingYN: Yes
  • Electricity On Property: Yes
  • Sewer: Public Sewer
  • Utilities: Electricity Connected, Cable Connected
  • Water Source: Public

Schools

  • Junior High Dist: Norwalk

Lot Info

  • Lot Dimensions: 120' x 150'
  • Lot Size Sq Ft: 20037.6
  • ResoLotSizeUnits: Square Feet
  • Additional Parcels Description: 330350050580000
  • Additional Parcels: Yes
  • Parcel Number: 330350050590000
  • ResoLotSizeUnits: SquareFeet

Tax Info

  • Tax Annual Amount: 1691.78

Ownership History

Date Name Owned For Owner Type

Purchase Details

Closed on
Feb 6, 2023
Sold by
Bibb Robert C and Bibb Y
Bought by
Bibb Barbara A and Bibb Y
Current Estimated Value
$197,103

Purchase Details

Listed on
Aug 13, 2022
Closed on
Oct 20, 2022
Sold by
Lesch Joseph R
Bought by
Bibb Robert C and Bibb Barbara A
Seller's Agent
Jay Ewell
Ewell & Associates
Buyer's Agent
Joseph Bibb
Bibb Realty
List Price
$159,900
Sold Price
$155,000
Premium/Discount to List
-$4,900
-3.06%

Home Financials for this Owner

Home Financials are based on the most recent Mortgage that was taken out on this home.
Avg. Annual Appreciation
8.28%
Original Mortgage
$124,000
Outstanding Balance
$119,845
Interest Rate
6.7%
Estimated Equity
$77,258

Purchase Details

Closed on
Oct 31, 2016
Sold by
Lesch Lisa M and Jenkins Lisa M
Bought by
Lesch Joseph R

Home Financials for this Owner

Home Financials are based on the most recent Mortgage that was taken out on this home.
Original Mortgage
$86,000
Interest Rate
3.5%
Mortgage Type
New Conventional

Purchase Details

Closed on
Apr 30, 2001
Sold by
Austin Mark A
Bought by
Lesch Joseph R and Jenkins Lisa M

Purchase Details

Closed on
Nov 3, 1992
Bought by
Austin Mark A
Source: Public Records

Range of Values:

Collateral Analytics

Collateral Analytics Collateral Analytics AVMs (Automated Valuation Model) employ a number of statistical approaches combined with neighborhood-specific comparable selection guarantees the most up-to-date and precise valuations.

Not Available

Collateral Analytics does not have data for the current month. Please view the chart for historical values.

ICE

ICE Mortgage Technology ICE Mortgage Technology’s AVM (Automated Valuation Model) is a state-of-the-art online residential property valuation tool that provides a quick and accurate estimate of the value of almost any home in the U.S.

Not Available

ICE Mortgage Technology does not have data for the current month. Please view the chart for historical values.

First American

First American First American Data & Analytics’ next-generation AVM combines unrivaled data assets with a blended ensemble of valuation models to produce highly accurate, reliable valuations you can trust.

Not Available

First American does not have data for the current month. Please view the chart for historical values.

Quantarium

Quantarium Quantarium’s valuation service, repeatedly proven the industry’s most accurate and comprehensive, is supercharged with a self-learning and auto-tuning AI engine that continually becomes smarter and more accurate as it processes daily inputs from the industry’s leading RE data lake.

Not Available

Quantarium does not have data for the current month. Please view the chart for historical values.

Average Value
Not Available
List Price
Sold Price
Create a Home Valuation Report for This Property
The Home Valuation Report is an in-depth analysis detailing your home's value as well as a comparison with similar homes in the area

Home Values in the Area

Source: Public Records

Average Home Value in this Area


Source: Public Records

Purchase History

Date Buyer Sale Price Title Company
Bibb Barbara A -- --
Bibb Robert C $155,000 Chicago Title
Lesch Joseph R -- Attorney
Lesch Joseph R $82,000 --
Austin Mark A $60,000 --
Source: Public Records

Mortgage History

Date Status Borrower Loan Amount
Open Bibb Robert C $124,000
Closed Lesch Joseph R $86,000
Source: Public Records

Property History

Date Event Price List to Sale Price per Sq Ft
10/20/2022 10/20/22 Sold $155,000 -3.1% $116 / Sq Ft
10/19/2022 10/19/22 Pending -- -- --
08/13/2022 08/13/22 For Sale $159,900 -- $120 / Sq Ft
Source: Firelands Association of REALTORS®

Tax History Compared to Growth

Source: Public Records

Tax History

Year Tax Paid Tax Assessment Tax Assessment Total Assessment is a certain percentage of the fair market value that is determined by local assessors to be the total taxable value of land and additions on the property. Land Improvement
2024 $2,236 $54,800 $7,500 $47,300
2023 $2,236 $41,290 $6,010 $35,280
2022 $1,664 $41,290 $6,010 $35,280
2021 $1,665 $41,290 $6,010 $35,280
2020 $1,498 $35,350 $6,010 $29,340
2019 $1,466 $35,350 $6,010 $29,340
2018 $1,573 $38,620 $6,010 $32,610
2017 $1,425 $34,860 $6,010 $28,850
2016 $1,398 $34,860 $6,010 $28,850
2015 $1,398 $34,860 $6,010 $28,850
2014 $1,398 $34,580 $6,020 $28,560
2013 $1,215 $34,580 $6,020 $28,560
Source: Public Records

Agents Affiliated with this Home

  • Section Image
  • Section Image
See All Agents

Map

Source: Firelands Association of REALTORS®

MLS Number: 20223296

APN: 33-0350-05-059-0000