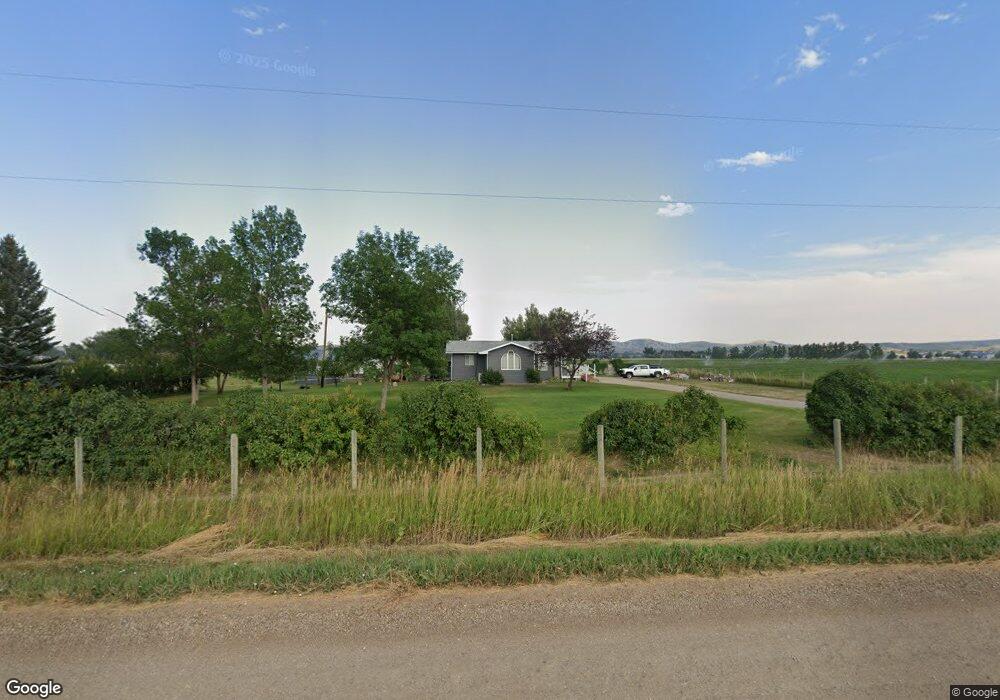
175 Upper Rd Sheridan, WY 82801
Estimated Value: $544,264 - $613,000
3
Beds
3
Baths
1,186
Sq Ft
$487/Sq Ft
Est. Value
About This Home
This home is located at 175 Upper Rd, Sheridan, WY 82801 and is currently estimated at $577,088, approximately $486 per square foot. 175 Upper Rd is a home.
Ownership History
Date
Name
Owned For
Owner Type
Purchase Details
Closed on
Apr 26, 2013
Sold by
Charlson Kevin W and Charlson Erin
Bought by
Beld Gary and Beld Lynette
Current Estimated Value
Home Financials for this Owner
Home Financials are based on the most recent Mortgage that was taken out on this home.
Original Mortgage
$280,612
Outstanding Balance
$200,532
Interest Rate
3.67%
Mortgage Type
New Conventional
Estimated Equity
$376,556
Purchase Details
Closed on
Aug 20, 2008
Sold by
Miech Edward F
Bought by
Charlson Kevin W and Charlson Erin
Home Financials for this Owner
Home Financials are based on the most recent Mortgage that was taken out on this home.
Original Mortgage
$95,000
Interest Rate
6.29%
Mortgage Type
Credit Line Revolving
Purchase Details
Closed on
Jan 31, 2007
Sold by
Williamson Robert D and Williamson Shelley L
Bought by
Charlson Kevin W and Charlson Erin
Purchase Details
Closed on
Jan 27, 2006
Sold by
Red Oak Properties Llc
Bought by
Charlson Kevin W and Charlson Erin
Create a Home Valuation Report for This Property
The Home Valuation Report is an in-depth analysis detailing your home's value as well as a comparison with similar homes in the area
Home Values in the Area
Average Home Value in this Area
Purchase History
| Date | Buyer | Sale Price | Title Company |
|---|---|---|---|
| Beld Gary | -- | None Available | |
| Charlson Kevin W | -- | None Available | |
| Charlson Kevin W | -- | None Available | |
| Charlson Kevin W | -- | None Available |
Source: Public Records
Mortgage History
| Date | Status | Borrower | Loan Amount |
|---|---|---|---|
| Open | Beld Gary | $280,612 | |
| Previous Owner | Charlson Kevin W | $95,000 |
Source: Public Records
Tax History Compared to Growth
Tax History
| Year | Tax Paid | Tax Assessment Tax Assessment Total Assessment is a certain percentage of the fair market value that is determined by local assessors to be the total taxable value of land and additions on the property. | Land | Improvement |
|---|---|---|---|---|
| 2025 | $3,174 | $36,247 | $14,630 | $21,617 |
| 2024 | $3,174 | $47,023 | $19,507 | $27,516 |
| 2023 | $3,156 | $46,760 | $18,153 | $28,607 |
| 2022 | $2,789 | $41,314 | $14,901 | $26,413 |
| 2021 | $2,302 | $34,110 | $12,598 | $21,512 |
| 2020 | $2,113 | $31,298 | $10,160 | $21,138 |
| 2019 | $1,994 | $29,538 | $10,160 | $19,378 |
| 2018 | $1,849 | $27,399 | $9,483 | $17,916 |
| 2017 | $1,869 | $27,092 | $9,212 | $17,880 |
| 2015 | $1,741 | $25,009 | $7,241 | $17,768 |
| 2014 | $1,758 | $25,252 | $7,241 | $18,011 |
| 2013 | -- | $21,536 | $7,241 | $14,295 |
Source: Public Records
Map
Nearby Homes
- 19 Spring Creek Ln
- 20 Roberts Dr
- 11 Indian Paintbrush Rd
- 91 Wyoming 335
- 21 Wishbone Way
- TBD Piccard Rd Unit Lot 31
- TBD Piccard Rd Unit Lot 29
- TBD Piccard Rd Unit Lot 27
- TBD Piccard Rd Unit Lot 26
- TBD Piccard Rd Unit Lot 24
- TBD Piccard Rd Unit Lot 19
- TBD Piccard Rd Unit Lot 15
- TBD Piccard Rd Unit Lot 22
- TBD Piccard Rd Unit Lot 21
- TBD Piccard Rd Unit Lot 25
- TBD Convair Rd Unit Lot 46
- TBD Convair Rd Unit Lot 44
- TBD Convair Rd Unit Lot 42
- 8 Buckskin Dr
- 11 Piccard Rd