Estimated Value: $241,000 - $288,000
3
Beds
2
Baths
1,904
Sq Ft
$138/Sq Ft
Est. Value
About This Home
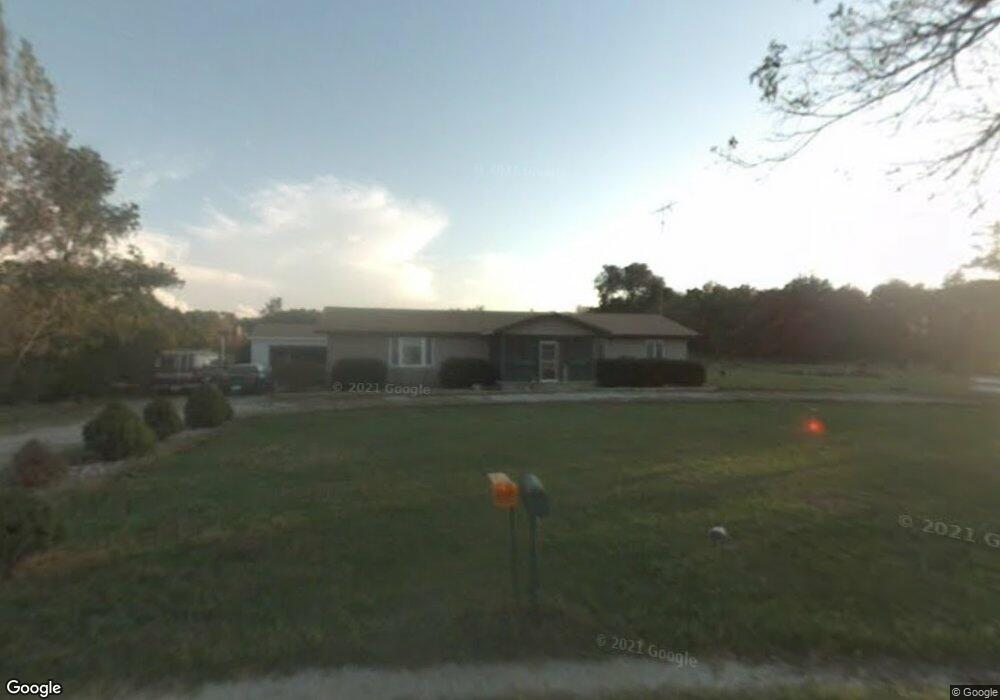
This home is located at 175 W 250 S, Knox, IN 46534 and is currently estimated at $263,024, approximately $138 per square foot. 175 W 250 S is a home located in Starke County with nearby schools including North Judson-San Pierre Elementary School and N. Judson-San Pierre Junior/Senior High School.
Ownership History
Date
Name
Owned For
Owner Type
Purchase Details
Closed on
Sep 22, 2017
Sold by
Howard Sandra G
Bought by
Brandon Crittendon
Current Estimated Value
Home Financials for this Owner
Home Financials are based on the most recent Mortgage that was taken out on this home.
Original Mortgage
$63,000
Outstanding Balance
$52,595
Interest Rate
3.89%
Mortgage Type
New Conventional
Estimated Equity
$210,429
Create a Home Valuation Report for This Property
The Home Valuation Report is an in-depth analysis detailing your home's value as well as a comparison with similar homes in the area
Home Values in the Area
Average Home Value in this Area
Purchase History
| Date | Buyer | Sale Price | Title Company |
|---|---|---|---|
| Brandon Crittendon | $70,000 | -- | |
| Crittendon Brandon | -- | None Available |
Source: Public Records
Mortgage History
| Date | Status | Borrower | Loan Amount |
|---|---|---|---|
| Open | Crittendon Brandon | $63,000 |
Source: Public Records
Tax History Compared to Growth
Tax History
| Year | Tax Paid | Tax Assessment Tax Assessment Total Assessment is a certain percentage of the fair market value that is determined by local assessors to be the total taxable value of land and additions on the property. | Land | Improvement |
|---|---|---|---|---|
| 2024 | $1,337 | $195,800 | $39,100 | $156,700 |
| 2023 | $1,260 | $179,500 | $33,300 | $146,200 |
| 2022 | $1,160 | $155,900 | $30,600 | $125,300 |
| 2021 | $1,039 | $131,400 | $28,700 | $102,700 |
| 2020 | $993 | $124,000 | $28,400 | $95,600 |
| 2019 | $873 | $115,300 | $26,200 | $89,100 |
| 2018 | $620 | $100,700 | $16,400 | $84,300 |
| 2017 | $579 | $99,800 | $16,300 | $83,500 |
| 2016 | $553 | $99,800 | $16,500 | $83,300 |
| 2014 | $529 | $101,300 | $16,300 | $85,000 |
| 2013 | $538 | $102,100 | $16,800 | $85,300 |
Source: Public Records
Map
Nearby Homes