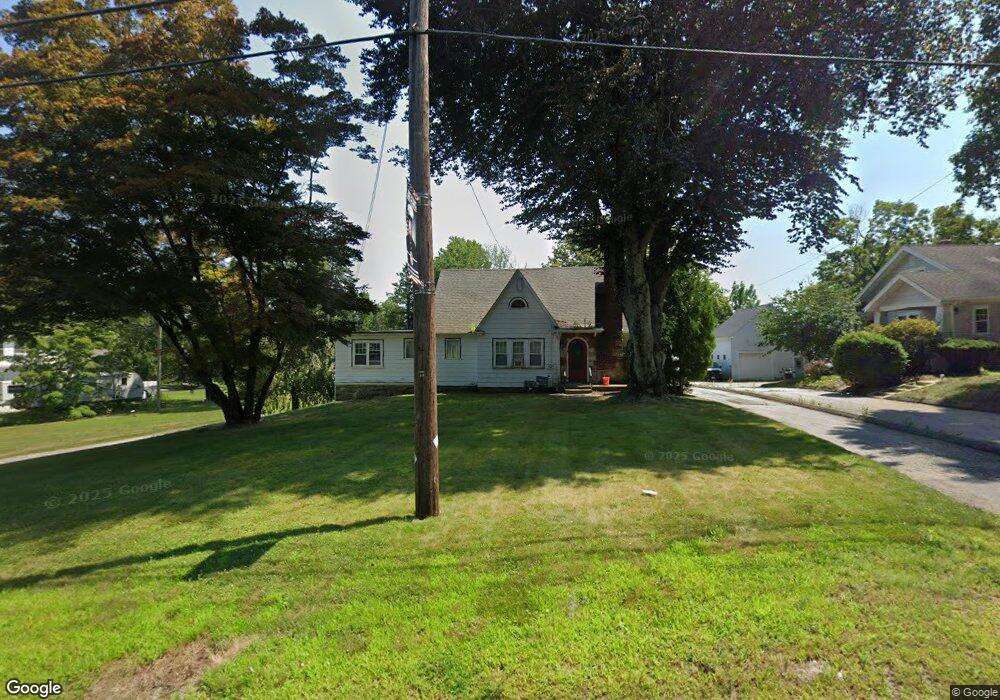
175 W Main St Dudley, MA 01571
Estimated Value: $409,228 - $574,000
5
Beds
3
Baths
2,570
Sq Ft
$192/Sq Ft
Est. Value
About This Home
This home is located at 175 W Main St, Dudley, MA 01571 and is currently estimated at $493,057, approximately $191 per square foot. 175 W Main St is a home located in Worcester County with nearby schools including Shepherd Hill Regional High School, All Saints Academy, and St Joseph School.
Ownership History
Date
Name
Owned For
Owner Type
Purchase Details
Closed on
Dec 1, 2023
Sold by
Byrnes Inv Group Llc
Bought by
Tetreault Brett M
Current Estimated Value
Home Financials for this Owner
Home Financials are based on the most recent Mortgage that was taken out on this home.
Original Mortgage
$420,000
Interest Rate
7%
Mortgage Type
Purchase Money Mortgage
Purchase Details
Closed on
Dec 20, 2019
Sold by
Burke Veronica Rose Est
Bought by
Byrnes Realty Llc
Home Financials for this Owner
Home Financials are based on the most recent Mortgage that was taken out on this home.
Original Mortgage
$228,000
Interest Rate
3.7%
Mortgage Type
New Conventional
Create a Home Valuation Report for This Property
The Home Valuation Report is an in-depth analysis detailing your home's value as well as a comparison with similar homes in the area
Home Values in the Area
Average Home Value in this Area
Purchase History
| Date | Buyer | Sale Price | Title Company |
|---|---|---|---|
| Tetreault Brett M | $525,000 | None Available | |
| Byrnes Realty Llc | $285,000 | None Available |
Source: Public Records
Mortgage History
| Date | Status | Borrower | Loan Amount |
|---|---|---|---|
| Previous Owner | Tetreault Brett M | $420,000 | |
| Previous Owner | Byrnes Realty Llc | $228,000 |
Source: Public Records
Tax History
| Year | Tax Paid | Tax Assessment Tax Assessment Total Assessment is a certain percentage of the fair market value that is determined by local assessors to be the total taxable value of land and additions on the property. | Land | Improvement |
|---|---|---|---|---|
| 2025 | $3,430 | $324,500 | $67,700 | $256,800 |
| 2024 | $3,221 | $307,300 | $64,100 | $243,200 |
| 2023 | $2,988 | $294,100 | $59,300 | $234,800 |
| 2022 | $3,009 | $257,200 | $52,000 | $205,200 |
| 2021 | $2,684 | $218,200 | $48,600 | $169,600 |
| 2020 | $2,536 | $194,200 | $45,200 | $149,000 |
| 2019 | $2,622 | $194,200 | $45,200 | $149,000 |
| 2018 | $2,235 | $190,500 | $45,200 | $145,300 |
| 2017 | $2,162 | $181,100 | $45,200 | $135,900 |
| 2016 | $2,140 | $175,700 | $43,100 | $132,600 |
| 2015 | $2,122 | $173,100 | $40,500 | $132,600 |
Source: Public Records
Map
Nearby Homes
Your Personal Tour Guide
Ask me questions while you tour the home.