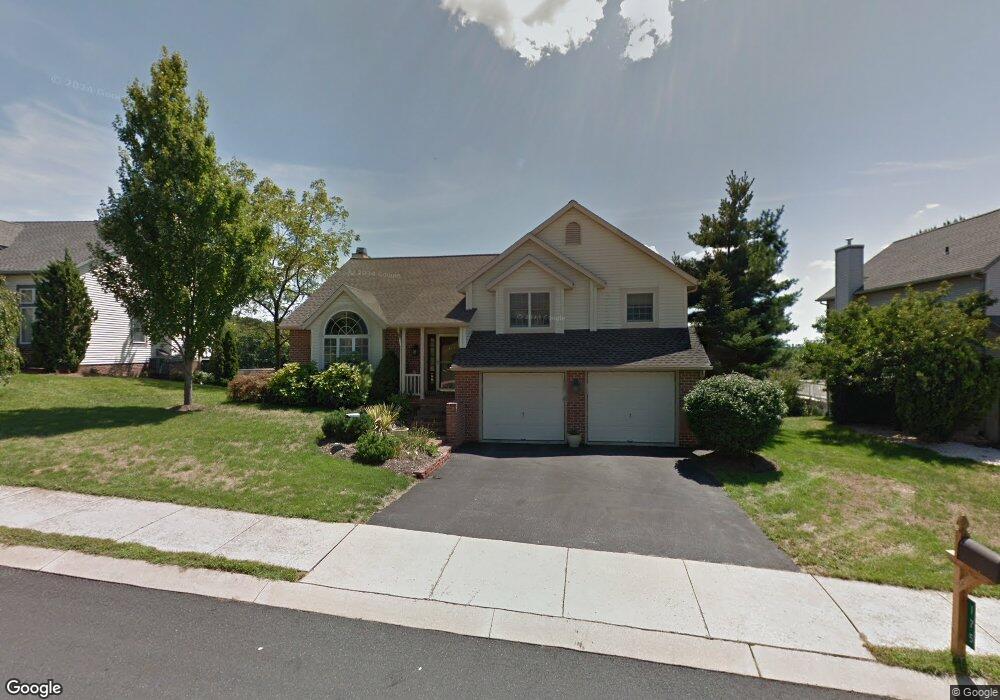
175 Windsor Dr Ephrata, PA 17522
Estimated Value: $369,727 - $442,000
3
Beds
2
Baths
1,448
Sq Ft
$281/Sq Ft
Est. Value
About This Home
This home is located at 175 Windsor Dr, Ephrata, PA 17522 and is currently estimated at $406,432, approximately $280 per square foot. 175 Windsor Dr is a home located in Lancaster County with nearby schools including Fulton El School, Ephrata Intermediate School, and Ephrata Senior High School.
Ownership History
Date
Name
Owned For
Owner Type
Purchase Details
Closed on
May 26, 2005
Sold by
Mackley David C and Witmer Sharon D
Bought by
Myer Douglas B and Myer Heather Ann
Current Estimated Value
Home Financials for this Owner
Home Financials are based on the most recent Mortgage that was taken out on this home.
Original Mortgage
$171,900
Outstanding Balance
$90,780
Interest Rate
5.94%
Mortgage Type
Fannie Mae Freddie Mac
Estimated Equity
$315,652
Create a Home Valuation Report for This Property
The Home Valuation Report is an in-depth analysis detailing your home's value as well as a comparison with similar homes in the area
Home Values in the Area
Average Home Value in this Area
Purchase History
| Date | Buyer | Sale Price | Title Company |
|---|---|---|---|
| Myer Douglas B | $214,900 | -- |
Source: Public Records
Mortgage History
| Date | Status | Borrower | Loan Amount |
|---|---|---|---|
| Open | Myer Douglas B | $171,900 |
Source: Public Records
Tax History
| Year | Tax Paid | Tax Assessment Tax Assessment Total Assessment is a certain percentage of the fair market value that is determined by local assessors to be the total taxable value of land and additions on the property. | Land | Improvement |
|---|---|---|---|---|
| 2025 | $5,182 | $216,100 | $52,800 | $163,300 |
| 2024 | $5,182 | $216,100 | $52,800 | $163,300 |
| 2023 | $5,055 | $216,100 | $52,800 | $163,300 |
| 2022 | $4,839 | $216,100 | $52,800 | $163,300 |
| 2021 | $4,738 | $216,100 | $52,800 | $163,300 |
| 2020 | $4,738 | $216,100 | $52,800 | $163,300 |
| 2019 | $4,673 | $216,100 | $52,800 | $163,300 |
| 2018 | $3,535 | $216,100 | $52,800 | $163,300 |
| 2017 | $4,634 | $175,100 | $41,300 | $133,800 |
| 2016 | $4,597 | $175,100 | $41,300 | $133,800 |
| 2015 | $1,016 | $175,100 | $41,300 | $133,800 |
| 2014 | $3,305 | $175,100 | $41,300 | $133,800 |
Source: Public Records
Map
Nearby Homes
Your Personal Tour Guide
Ask me questions while you tour the home.