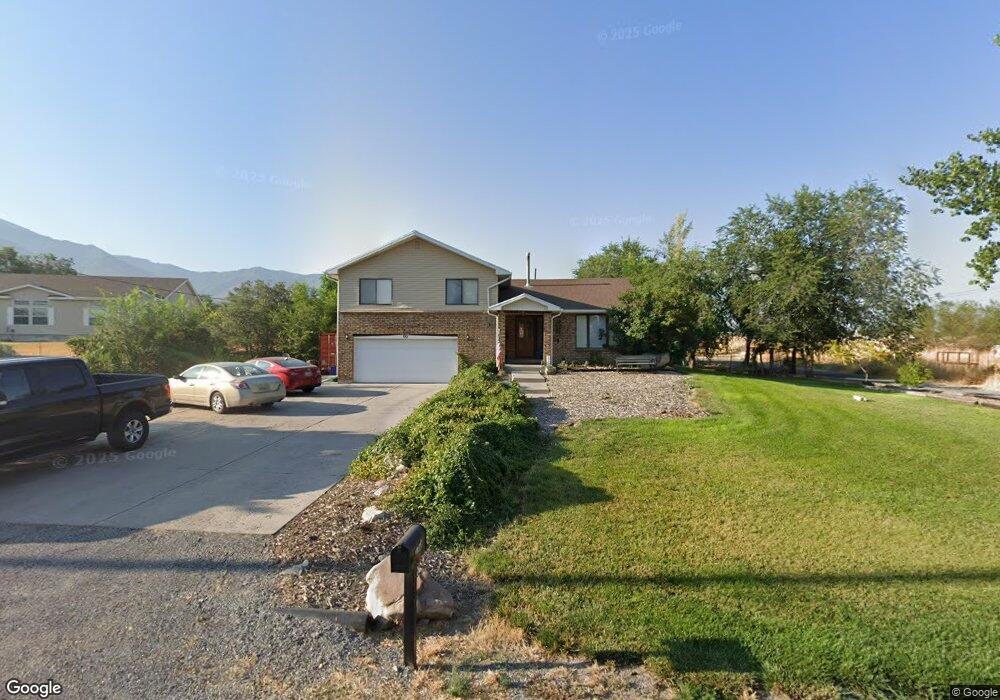
1750 Canyon Rd Tooele, UT 84074
Estimated Value: $542,000 - $717,000
--
Bed
--
Bath
2,262
Sq Ft
$280/Sq Ft
Est. Value
About This Home
This home is located at 1750 Canyon Rd, Tooele, UT 84074 and is currently estimated at $633,517, approximately $280 per square foot. 1750 Canyon Rd is a home with nearby schools including Old Mill Elementary School, Clarke N. Johnsen Junior High School, and Stansbury High School.
Ownership History
Date
Name
Owned For
Owner Type
Purchase Details
Closed on
Jul 31, 2023
Sold by
Conover Charla
Bought by
Law Charla Kay and Law Lawrence M
Current Estimated Value
Purchase Details
Closed on
Nov 2, 2018
Sold by
Conover Jon
Bought by
Conover Charla
Purchase Details
Closed on
May 2, 2006
Sold by
Haws Donald L and Haws Darla J
Bought by
Conover Jon and Conover Charla
Home Financials for this Owner
Home Financials are based on the most recent Mortgage that was taken out on this home.
Original Mortgage
$212,000
Interest Rate
6.29%
Mortgage Type
New Conventional
Create a Home Valuation Report for This Property
The Home Valuation Report is an in-depth analysis detailing your home's value as well as a comparison with similar homes in the area
Home Values in the Area
Average Home Value in this Area
Purchase History
| Date | Buyer | Sale Price | Title Company |
|---|---|---|---|
| Law Charla Kay | -- | Old Republic Title | |
| Conover Charla | -- | None Available | |
| Conover Jon | -- | Sudance Title Insurance Agen |
Source: Public Records
Mortgage History
| Date | Status | Borrower | Loan Amount |
|---|---|---|---|
| Previous Owner | Conover Jon | $212,000 |
Source: Public Records
Tax History Compared to Growth
Tax History
| Year | Tax Paid | Tax Assessment Tax Assessment Total Assessment is a certain percentage of the fair market value that is determined by local assessors to be the total taxable value of land and additions on the property. | Land | Improvement |
|---|---|---|---|---|
| 2025 | $1,823 | $621,270 | $283,500 | $337,770 |
| 2024 | $2,172 | $376,517 | $184,500 | $192,017 |
| 2023 | $2,172 | $376,031 | $203,750 | $172,281 |
| 2022 | $3,910 | $345,619 | $182,800 | $162,819 |
| 2021 | $3,889 | $287,696 | $108,000 | $179,696 |
| 2020 | $3,701 | $443,235 | $120,640 | $322,595 |
| 2019 | $3,108 | $362,205 | $120,640 | $241,565 |
| 2018 | $3,129 | $337,243 | $125,800 | $211,443 |
| 2017 | $2,713 | $309,729 | $125,800 | $183,929 |
| 2016 | $2,623 | $188,632 | $92,050 | $96,582 |
| 2015 | $2,623 | $188,632 | $0 | $0 |
| 2014 | -- | $188,632 | $0 | $0 |
Source: Public Records
Map
Nearby Homes
- 1950 Pebble Cir
- 1884 Shepard Ln
- 8035 N Park Meadow Ln Unit 2
- 7925 N Spring Valley Ln Unit 322
- 1904 E Rock Hollow Rd
- 1887 E Rock Hollow Rd
- 1897 E Rock Hollow Rd
- 1668 E Corey's Way
- 1426 E Cluff Ln
- 8260 Strasser Ct Unit 429
- 1214 E Highline Rd Unit 208
- Ponderosa Plan at Pastures at Saddleback
- Bedford Plan at Pastures at Saddleback
- 8635 N Halloran Ct Unit 1322
- Anika Plan at Pastures at Saddleback
- Hemingway Plan at Pastures at Saddleback
- Coronado Plan at Pastures at Saddleback
- 8761 N Lakeshore Dr Unit 1203
- 8635 N Halloran Ct
- Presley Plan at Pastures at Saddleback
- 1700 Canyon Rd
- 1728 Canyon Rd
- 7609 Mountain View Rd
- 1727 Canyon Rd
- 7609 N Mountian View E
- 1764 Canyon Rd
- 1762 Canyon Rd
- 1708 Canyon Rd
- 1788 Canyon Rd
- 1816 Canyon Rd
- 1666 Canyon Rd
- 1651 Canyon Rd
- 7701 Mountain View Rd
- 7706 Mountain View Rd
- 7584 Foothill Dr
- 7562 Foothill Dr
- 7540 Foothill Dr
- 1873 Canyon Rd
- 7518 Foothill Dr
- 7551 N Foothill Way