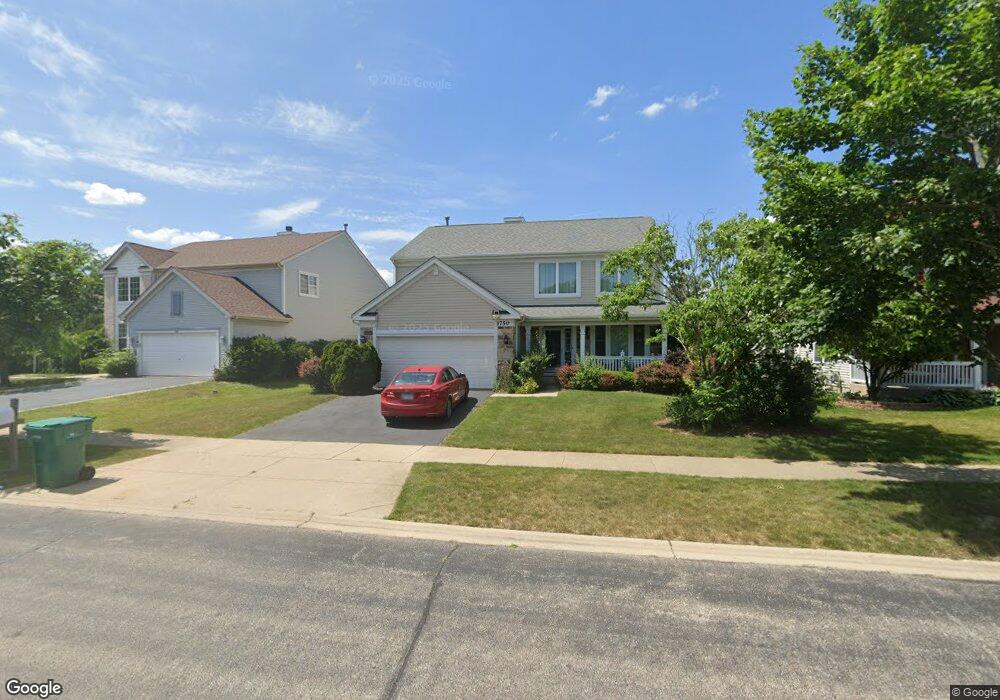
1750 Charles Dr Wheeling, IL 60090
Estimated Value: $581,559 - $643,000
4
Beds
2
Baths
2,561
Sq Ft
$239/Sq Ft
Est. Value
About This Home
This home is located at 1750 Charles Dr, Wheeling, IL 60090 and is currently estimated at $612,640, approximately $239 per square foot. 1750 Charles Dr is a home located in Cook County with nearby schools including Frost Elementary School, Oliver W Holmes Middle School, and Wheeling High School.
Ownership History
Date
Name
Owned For
Owner Type
Purchase Details
Closed on
Nov 5, 2010
Sold by
Kleyman Irina and Safonov Serguei
Bought by
Safonov Irina and Safonov Serguei
Current Estimated Value
Home Financials for this Owner
Home Financials are based on the most recent Mortgage that was taken out on this home.
Original Mortgage
$307,000
Outstanding Balance
$199,750
Interest Rate
4.23%
Mortgage Type
New Conventional
Estimated Equity
$412,890
Purchase Details
Closed on
May 18, 2004
Sold by
Slater Andrew D and Slater Tatyana
Bought by
Safonov Serguei and Kleyman Irina
Home Financials for this Owner
Home Financials are based on the most recent Mortgage that was taken out on this home.
Original Mortgage
$333,700
Interest Rate
5.91%
Mortgage Type
Balloon
Purchase Details
Closed on
Oct 1, 2001
Sold by
Avalon Sienna Iii Llc
Bought by
Slater Andrew D and Slater Tatyana
Home Financials for this Owner
Home Financials are based on the most recent Mortgage that was taken out on this home.
Original Mortgage
$240,000
Interest Rate
6.92%
Create a Home Valuation Report for This Property
The Home Valuation Report is an in-depth analysis detailing your home's value as well as a comparison with similar homes in the area
Home Values in the Area
Average Home Value in this Area
Purchase History
| Date | Buyer | Sale Price | Title Company |
|---|---|---|---|
| Safonov Irina | -- | Cambridge Title Company | |
| Safonov Serguei | $450,000 | Rtc | |
| Slater Andrew D | $320,500 | -- |
Source: Public Records
Mortgage History
| Date | Status | Borrower | Loan Amount |
|---|---|---|---|
| Open | Safonov Irina | $307,000 | |
| Closed | Safonov Serguei | $333,700 | |
| Previous Owner | Slater Andrew D | $240,000 | |
| Closed | Safonov Serguei | $71,300 |
Source: Public Records
Tax History
| Year | Tax Paid | Tax Assessment Tax Assessment Total Assessment is a certain percentage of the fair market value that is determined by local assessors to be the total taxable value of land and additions on the property. | Land | Improvement |
|---|---|---|---|---|
| 2025 | $12,082 | $54,000 | $12,159 | $41,841 |
| 2024 | $12,082 | $39,128 | $14,030 | $25,098 |
| 2023 | $11,486 | $39,128 | $14,030 | $25,098 |
| 2022 | $11,486 | $39,128 | $14,030 | $25,098 |
| 2021 | $10,840 | $32,381 | $7,014 | $25,367 |
| 2020 | $10,630 | $32,381 | $7,014 | $25,367 |
| 2019 | $10,834 | $36,261 | $7,014 | $29,247 |
| 2018 | $12,868 | $38,476 | $6,079 | $32,397 |
| 2017 | $12,617 | $38,476 | $6,079 | $32,397 |
| 2016 | $12,073 | $38,476 | $6,079 | $32,397 |
| 2015 | $12,936 | $38,691 | $5,377 | $33,314 |
| 2014 | $12,623 | $38,691 | $5,377 | $33,314 |
| 2013 | $11,664 | $38,691 | $5,377 | $33,314 |
Source: Public Records
Map
Nearby Homes
- 15 E Willow Rd
- 1450 Sandpebble Dr Unit 333
- 1525 Sander Ct Unit 113
- 1430 Sandstone Dr Unit 202
- 448 Bridle Trail Unit 211
- 523 Bridle Trail Unit 161
- 105 E Elaine Cir
- 103 Coldren Dr
- 674 Pinecrest Dr Unit 203
- 664 Pinecrest Dr Unit 302
- 18 E Old Willow Rd Unit 210N
- 18 E Old Willow Rd Unit 535N
- 16 E Old Willow Rd Unit 435S
- 16 E Old Willow Rd Unit 202S
- 1033 Wheeling Rd
- 1201 Pleasant Run Dr Unit 312
- 802 Andover Ct
- 13 W Kenilworth Ave
- 988 Ridgefield Ln Unit 54
- 206 E Camp Mcdonald Rd
- 1742 Charles Dr
- 1760 Charles Dr
- 115 Muret Ct
- 1732 Charles Dr
- 105 Muret Ct
- 125 Muret Ct
- 1755 Charles Dr
- 1722 Charles Dr
- 1765 Charles Dr
- 1730 Geneva Dr Unit 251713
- 1732 Geneva Dr Unit 252714
- 100 Muret Ct
- 1734 Geneva Dr Unit 253714
- 1734 Geneva Dr Unit 1734
- 1770 Geneva Dr Unit 283713
- 1770 Geneva Dr Unit N
- 1712 Charles Dr
- 1721 Sienna Ct Unit 241714
- 1740 Geneva Dr Unit 263713
- 1774 Geneva Dr Unit 281714
Your Personal Tour Guide
Ask me questions while you tour the home.