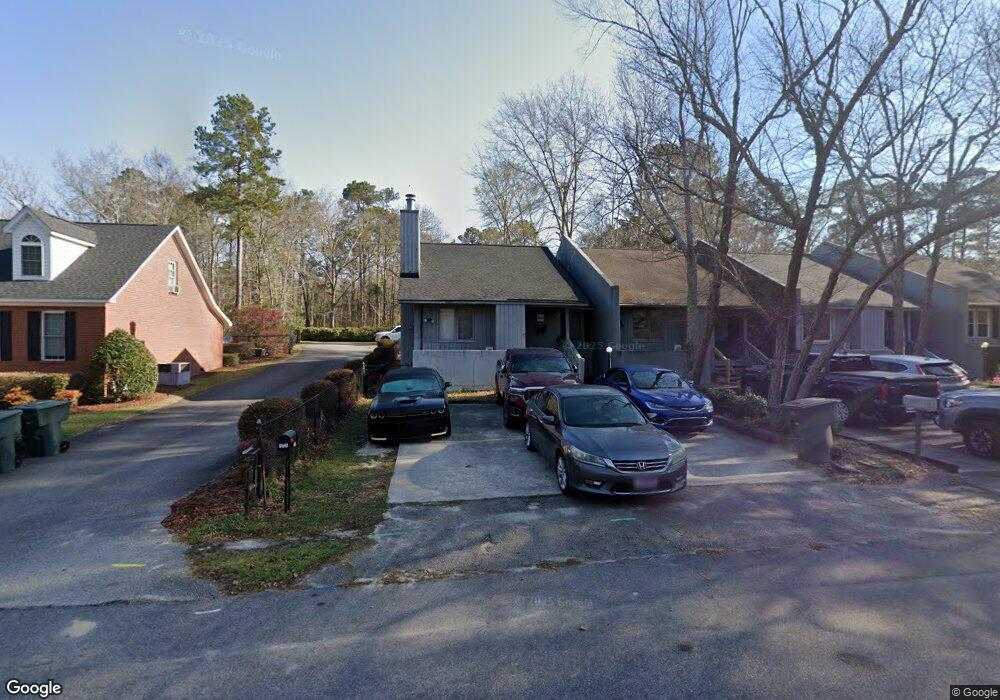
1750 Churchill Rd Orangeburg, SC 29118
Estimated Value: $104,000 - $136,000
2
Beds
2
Baths
1,055
Sq Ft
$114/Sq Ft
Est. Value
About This Home
This home is located at 1750 Churchill Rd, Orangeburg, SC 29118 and is currently estimated at $120,641, approximately $114 per square foot. 1750 Churchill Rd is a home located in Orangeburg County with nearby schools including Marshall Elementary School, Marshall Elementary, and William J. Clark Middle School.
Ownership History
Date
Name
Owned For
Owner Type
Purchase Details
Closed on
May 25, 2023
Sold by
Kennerly Denise
Bought by
Welfare Robert C
Current Estimated Value
Home Financials for this Owner
Home Financials are based on the most recent Mortgage that was taken out on this home.
Original Mortgage
$101,250
Outstanding Balance
$98,526
Interest Rate
6.57%
Estimated Equity
$22,115
Purchase Details
Closed on
Feb 7, 2019
Sold by
Barwick Christopher Allen and Barwick Luc Iien
Bought by
Kennerly Denise
Home Financials for this Owner
Home Financials are based on the most recent Mortgage that was taken out on this home.
Original Mortgage
$57,000
Interest Rate
4.5%
Mortgage Type
New Conventional
Purchase Details
Closed on
Nov 20, 2008
Sold by
Mcdonald Mary
Bought by
Barwick Christopher Allen and Barwick Lucy Ileen
Home Financials for this Owner
Home Financials are based on the most recent Mortgage that was taken out on this home.
Original Mortgage
$70,200
Interest Rate
7.5%
Mortgage Type
Unknown
Create a Home Valuation Report for This Property
The Home Valuation Report is an in-depth analysis detailing your home's value as well as a comparison with similar homes in the area
Home Values in the Area
Average Home Value in this Area
Purchase History
| Date | Buyer | Sale Price | Title Company |
|---|---|---|---|
| Welfare Robert C | $112,500 | None Listed On Document | |
| Kennerly Denise | $77,000 | None Available | |
| Barwick Christopher Allen | $78,000 | -- |
Source: Public Records
Mortgage History
| Date | Status | Borrower | Loan Amount |
|---|---|---|---|
| Open | Welfare Robert C | $101,250 | |
| Previous Owner | Kennerly Denise | $57,000 | |
| Previous Owner | Barwick Christopher Allen | $70,200 |
Source: Public Records
Tax History Compared to Growth
Tax History
| Year | Tax Paid | Tax Assessment Tax Assessment Total Assessment is a certain percentage of the fair market value that is determined by local assessors to be the total taxable value of land and additions on the property. | Land | Improvement |
|---|---|---|---|---|
| 2024 | $823 | $6,750 | $708 | $6,042 |
| 2023 | $263 | $4,354 | $652 | $3,702 |
| 2022 | $245 | $4,354 | $652 | $3,702 |
| 2021 | $243 | $4,354 | $652 | $3,702 |
| 2020 | $771 | $4,354 | $0 | $0 |
| 2019 | $774 | $4,354 | $0 | $0 |
| 2018 | $739 | $4,348 | $0 | $0 |
| 2017 | $710 | $4,348 | $0 | $0 |
| 2016 | $709 | $4,348 | $0 | $0 |
| 2015 | $414 | $4,348 | $0 | $0 |
| 2014 | $414 | $4,348 | $652 | $3,696 |
| 2013 | -- | $3,146 | $434 | $2,712 |
Source: Public Records
Map
Nearby Homes
- 00 Riley St
- 0 Riley St
- 2778 Riley St
- 2415 Riley St
- 336 Young Town Cir
- 312 Young Town Cir
- 272 Young Town Cir
- 284 Young Town Cir
- 2136 Pinnacle St
- 360 Young Town Cir
- 2753 Hillcrest St NE
- 2753 Hillcrest Ave
- 122 Remote Dr
- 249 Young Town Cir
- 237 Young Town Cir
- 2220 Hillside St
- 2220 Hillside St NE
- 2069 Hydrick Ave
- 1446 Ridgewood Dr
- 2251 Hillcrest Ave Unit 6C
- 1750 Churchill Rd Unit 1
- 1726 Churchill Rd NE
- 1724 Churchill Rd NE
- 1720 Churchill Rd
- 1720 Churchill Rd NE
- 1722 Churchill Rd NE
- 1797 Churchill Rd
- 1755 Churchill Rd
- 1721 Churchill Rd
- 1681 Spring Valley Cir
- 1752 Briarwood St
- 1787 Churchill Rd
- 1724 Briarwood St NE
- 1784 Briarwood St
- 1649 Spring Valley Cir
- 1670 Spring Valley Cir
- 1796 Briarwood St
- 1654 Spring Valley Cir
- 1654 Spring Valley Cir
- 1735 Elizabeth St