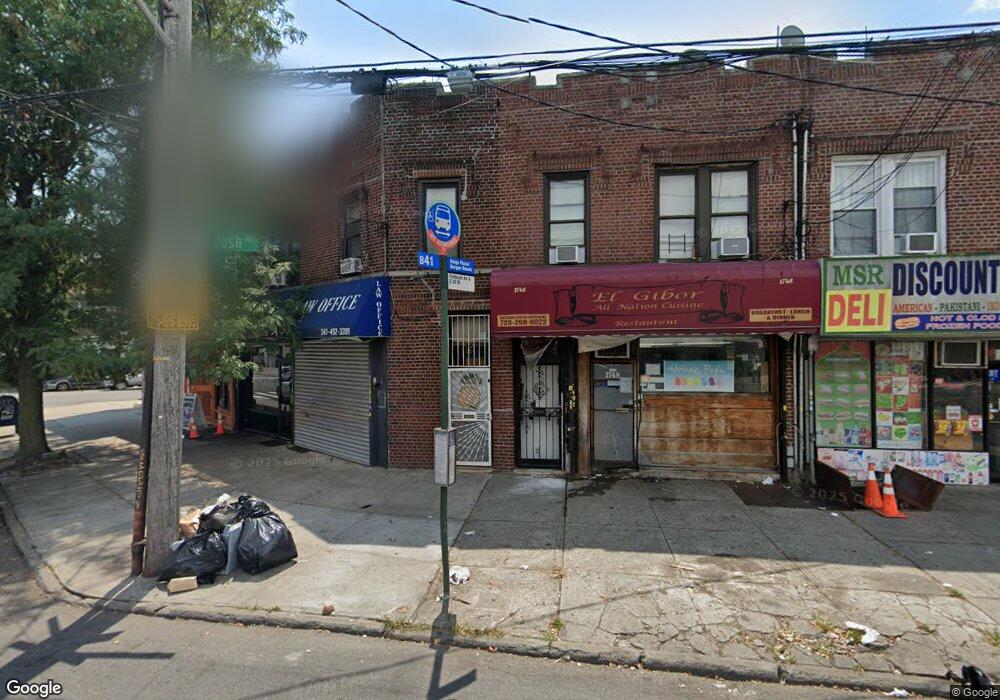
1750 Flatbush Ave Brooklyn, NY 11210
Flatlands NeighborhoodEstimated Value: $782,608
Studio
--
Bath
950
Sq Ft
$824/Sq Ft
Est. Value
About This Home
This home is located at 1750 Flatbush Ave, Brooklyn, NY 11210 and is currently estimated at $782,608, approximately $823 per square foot. 1750 Flatbush Ave is a home located in Kings County with nearby schools including P.S. 193 Gil Hodges, Andries Hudde School, and Mesivta Tiferes Yisroel.
Ownership History
Date
Name
Owned For
Owner Type
Purchase Details
Closed on
Jun 20, 2024
Sold by
Edj Group Llc
Bought by
Rj 1750 Llc
Current Estimated Value
Home Financials for this Owner
Home Financials are based on the most recent Mortgage that was taken out on this home.
Original Mortgage
$450,000
Outstanding Balance
$443,453
Interest Rate
7.02%
Mortgage Type
Purchase Money Mortgage
Estimated Equity
$339,155
Purchase Details
Closed on
Jun 30, 2017
Sold by
Nackab Sabrina
Bought by
Edj Group Llc
Home Financials for this Owner
Home Financials are based on the most recent Mortgage that was taken out on this home.
Original Mortgage
$400,000
Interest Rate
3.88%
Mortgage Type
Commercial
Purchase Details
Closed on
Mar 10, 2016
Sold by
1119 38Th Street Llc and Kanfer
Bought by
Nackab Sabrina
Purchase Details
Closed on
Jun 15, 2012
Sold by
Kanfer Gregory and Shur Realty Inc
Bought by
1119 38Th Street Llc and Kanfer
Purchase Details
Closed on
Apr 12, 2002
Sold by
Aloysius O Bannon Inc
Bought by
Shur Realty Inc
Create a Home Valuation Report for This Property
The Home Valuation Report is an in-depth analysis detailing your home's value as well as a comparison with similar homes in the area
Home Values in the Area
Average Home Value in this Area
Purchase History
| Date | Buyer | Sale Price | Title Company |
|---|---|---|---|
| Rj 1750 Llc | $720,000 | -- | |
| Rj 1750 Llc | $720,000 | -- | |
| Edj Group Llc | -- | -- | |
| Edj Group Llc | -- | -- | |
| Edj Group Llc | -- | -- | |
| Nackab Sabrina | $550,000 | -- | |
| Nackab Sabrina | $550,000 | -- | |
| Nackab Sabrina | $550,000 | -- | |
| 1119 38Th Street Llc | -- | -- | |
| 1119 38Th Street Llc | -- | -- | |
| Shur Realty Inc | -- | -- | |
| Shur Realty Inc | -- | -- |
Source: Public Records
Mortgage History
| Date | Status | Borrower | Loan Amount |
|---|---|---|---|
| Open | Rj 1750 Llc | $450,000 | |
| Closed | Rj 1750 Llc | $450,000 | |
| Previous Owner | Edj Group Llc | $400,000 |
Source: Public Records
Tax History
| Year | Tax Paid | Tax Assessment Tax Assessment Total Assessment is a certain percentage of the fair market value that is determined by local assessors to be the total taxable value of land and additions on the property. | Land | Improvement |
|---|---|---|---|---|
| 2025 | $5,637 | $43,440 | $10,080 | $33,360 |
| 2024 | $5,637 | $45,720 | $10,080 | $35,640 |
| 2023 | $5,404 | $43,800 | $10,080 | $33,720 |
| 2022 | $5,243 | $37,980 | $10,080 | $27,900 |
| 2021 | $5,365 | $33,240 | $10,080 | $23,160 |
| 2020 | $2,516 | $39,360 | $10,080 | $29,280 |
| 2019 | $4,893 | $39,360 | $10,080 | $29,280 |
| 2018 | $4,462 | $22,176 | $6,811 | $15,365 |
| 2017 | $4,462 | $21,888 | $7,210 | $14,678 |
| 2016 | $3,937 | $21,246 | $8,398 | $12,848 |
Source: Public Records
Map
Nearby Homes
- 1810 Avenue N Unit 4C
- 1810 Avenue N Unit 2F
- 1742 Flatbush Ave
- 1746 Flatbush Ave
- 1144 E 37th St
- 1708 Flatbush Ave
- 3412 Avenue J
- 3402 Avenue J
- 3523 Avenue I
- 3517 Avenue I
- 1804 New York Ave
- 945 E 32nd St
- 1533 - 1535 New York Ave
- 973 E 32nd St
- 1229 E 37th St
- 1655 Flatbush Ave Unit A1004
- 1655 Flatbush Ave Unit B711
- 1655 Flatbush Ave Unit B1809
- 1655 Flatbush Ave Unit A602
- 1655 Flatbush Ave Unit B1802
- 1748 Flatbush Ave Unit 2-R
- 1748 Flatbush Ave
- 1748 Flatbush Ave Unit 2F
- 1752 Flatbush Ave
- 1752 Flatbush Ave Unit 1F
- 1744 Flatbush Ave
- 3417 Avenue J
- 1740 Flatbush Ave Unit 3
- 1740 Flatbush Ave
- 1740 Flatbush Ave Unit 2
- 1738 Flatbush Ave
- 1736 Flatbush Ave
- 3401 Avenue J Unit 59
- 1733 Flatbush Ave
- 1734 Flatbush Ave
- 1735 Flatbush Ave
- 1729 Flatbush Ave
- 1739 Flatbush Ave
- 1741 Flatbush Ave Unit 3FL
- 1741 Flatbush Ave
Your Personal Tour Guide
Ask me questions while you tour the home.