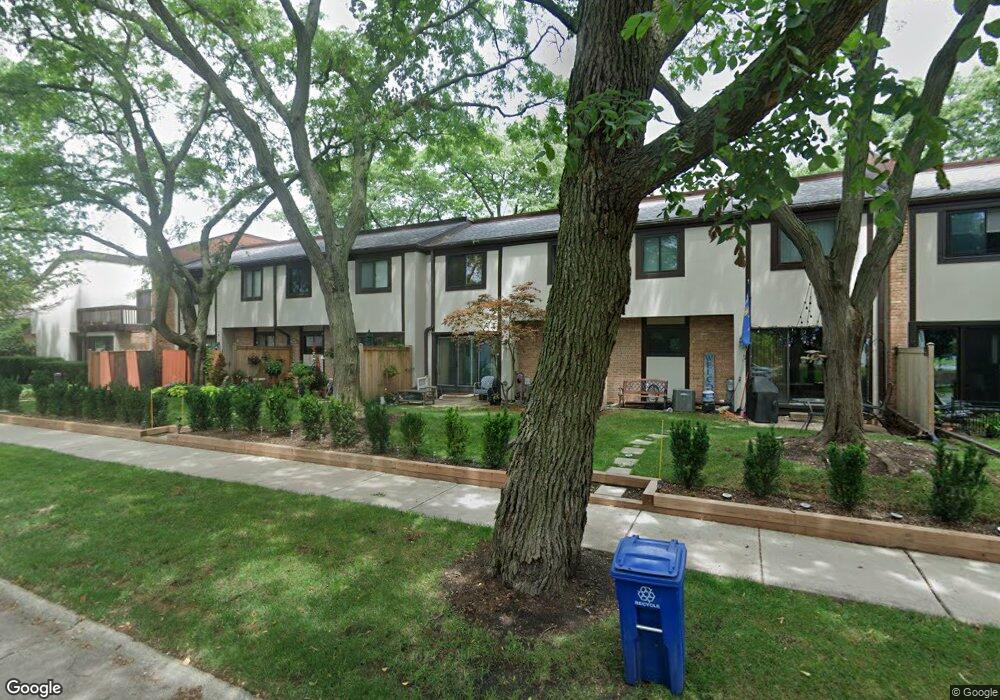
1750 Henley St Unit 22 Glenview, IL 60025
Estimated Value: $400,532 - $524,000
3
Beds
--
Bath
47,052
Sq Ft
$9/Sq Ft
Est. Value
About This Home
This home is located at 1750 Henley St Unit 22, Glenview, IL 60025 and is currently estimated at $445,383, approximately $9 per square foot. 1750 Henley St Unit 22 is a home located in Cook County with nearby schools including Lyon Elementary School, Pleasant Ridge Elementary School, and Springman Middle School.
Ownership History
Date
Name
Owned For
Owner Type
Purchase Details
Closed on
Nov 11, 2010
Sold by
Khazin Yevgeniy and Khazin Ekaterina
Bought by
Khazin Yevgeniy and Khazin Olga
Current Estimated Value
Purchase Details
Closed on
Dec 1, 2000
Sold by
Huguelet Thomas M and Huguelet Susan C
Bought by
Khazin Yevgeniy
Home Financials for this Owner
Home Financials are based on the most recent Mortgage that was taken out on this home.
Original Mortgage
$185,600
Outstanding Balance
$68,395
Interest Rate
7.7%
Estimated Equity
$376,988
Purchase Details
Closed on
May 27, 1994
Sold by
Battista Robert J and Battista Marni
Bought by
Huguelet Thomas M and Huguelet Susan C
Home Financials for this Owner
Home Financials are based on the most recent Mortgage that was taken out on this home.
Original Mortgage
$150,000
Interest Rate
7.5%
Create a Home Valuation Report for This Property
The Home Valuation Report is an in-depth analysis detailing your home's value as well as a comparison with similar homes in the area
Home Values in the Area
Average Home Value in this Area
Purchase History
| Date | Buyer | Sale Price | Title Company |
|---|---|---|---|
| Khazin Yevgeniy | -- | None Available | |
| Khazin Yevgeniy | $232,000 | First American Title | |
| Huguelet Thomas M | $167,500 | -- |
Source: Public Records
Mortgage History
| Date | Status | Borrower | Loan Amount |
|---|---|---|---|
| Open | Khazin Yevgeniy | $185,600 | |
| Previous Owner | Huguelet Thomas M | $150,000 |
Source: Public Records
Tax History Compared to Growth
Tax History
| Year | Tax Paid | Tax Assessment Tax Assessment Total Assessment is a certain percentage of the fair market value that is determined by local assessors to be the total taxable value of land and additions on the property. | Land | Improvement |
|---|---|---|---|---|
| 2024 | $6,411 | $32,281 | $3,839 | $28,442 |
| 2023 | $6,207 | $32,281 | $3,839 | $28,442 |
| 2022 | $6,207 | $32,281 | $3,839 | $28,442 |
| 2021 | $5,433 | $25,159 | $2,939 | $22,220 |
| 2020 | $5,425 | $25,159 | $2,939 | $22,220 |
| 2019 | $5,063 | $27,704 | $2,939 | $24,765 |
| 2018 | $4,059 | $21,082 | $1,439 | $19,643 |
| 2017 | $3,964 | $21,082 | $1,439 | $19,643 |
| 2016 | $3,931 | $21,082 | $1,439 | $19,643 |
| 2015 | $4,733 | $22,500 | $2,099 | $20,401 |
| 2014 | $4,659 | $22,500 | $2,099 | $20,401 |
| 2013 | $4,504 | $22,500 | $2,099 | $20,401 |
Source: Public Records
Map
Nearby Homes
- 1800 Dewes St Unit 305
- 1800 Dewes St Unit 201
- 713 Carriage Hill Dr
- 711 Carriage Hill Dr
- 609 Carriage Hill Dr
- 601 Carriage Hill Dr
- 1220 Depot St Unit 305
- 1220 Depot St Unit 109
- 1220 Depot St Unit 409
- 1752 Maclean Ct
- 1821 George Ct
- 2137 Glenview Rd
- 1123 Longvalley Rd
- 1121 Longvalley Rd
- 1342 Pine St
- 1341 Greenwillow Ln Unit C
- 245 Nora Ave
- 315 Lincoln St
- 517 Briarhill Ln
- 1750 Henley St Unit 21
- 1750 Henley St Unit 16
- 1734 Henley St Unit 5
- 1734 Henley St Unit 1
- 1750 Henley St Unit 24
- 1750 Henley St Unit 26
- 1734 Henley St Unit 6
- 1750 Henley St Unit 15
- 1734 Henley St Unit 8
- 1750 Henley St Unit 20
- 1734 Henley St Unit 4
- 1750 Henley St Unit 25
- 1734 Henley St Unit 9
- 1750 Henley St Unit 23
- 1750 Henley St Unit 19
- 1750 Henley St Unit 14
- 1734 Henley St Unit 2
- 1734 Henley St Unit 11
- 1734 Henley St Unit 13
- 1734 Henley St Unit 12