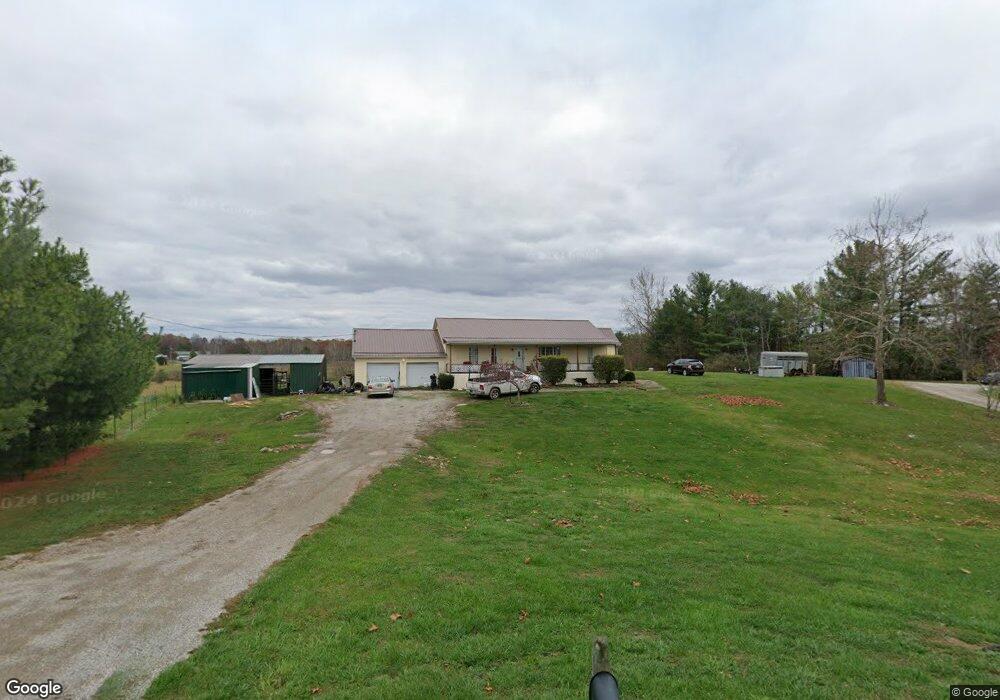
1750 Monroe Hickory Rd Oak Hill, OH 45656
Estimated Value: $195,000 - $246,425
3
Beds
2
Baths
1,500
Sq Ft
$148/Sq Ft
Est. Value
About This Home
This home is located at 1750 Monroe Hickory Rd, Oak Hill, OH 45656 and is currently estimated at $221,356, approximately $147 per square foot. 1750 Monroe Hickory Rd is a home located in Jackson County with nearby schools including Oak Hill Elementary School and Oak Hill Middle/High School.
Ownership History
Date
Name
Owned For
Owner Type
Purchase Details
Closed on
Aug 10, 2017
Sold by
Farrar Jeffrey T and Farrar April
Bought by
Butler Joshua E and Butler Kelli M
Current Estimated Value
Home Financials for this Owner
Home Financials are based on the most recent Mortgage that was taken out on this home.
Original Mortgage
$91,485
Outstanding Balance
$77,656
Interest Rate
4.62%
Mortgage Type
FHA
Estimated Equity
$143,700
Purchase Details
Closed on
Nov 1, 2005
Sold by
Blagg Kevin D and Blagg Robin R
Bought by
Farrar Jeffrey T and Farrar April
Home Financials for this Owner
Home Financials are based on the most recent Mortgage that was taken out on this home.
Original Mortgage
$94,100
Interest Rate
6.12%
Mortgage Type
Adjustable Rate Mortgage/ARM
Purchase Details
Closed on
Jan 9, 2002
Sold by
Cox William and Cox Joanne
Bought by
Blagg Kevin D and Blagg Robin R
Create a Home Valuation Report for This Property
The Home Valuation Report is an in-depth analysis detailing your home's value as well as a comparison with similar homes in the area
Home Values in the Area
Average Home Value in this Area
Purchase History
| Date | Buyer | Sale Price | Title Company |
|---|---|---|---|
| Butler Joshua E | $112,000 | Fidelity Lawyers Title Agenc | |
| Farrar Jeffrey T | $94,225 | None Available | |
| Blagg Kevin D | $75,000 | -- |
Source: Public Records
Mortgage History
| Date | Status | Borrower | Loan Amount |
|---|---|---|---|
| Open | Butler Joshua E | $91,485 | |
| Previous Owner | Farrar Jeffrey T | $94,100 |
Source: Public Records
Tax History Compared to Growth
Tax History
| Year | Tax Paid | Tax Assessment Tax Assessment Total Assessment is a certain percentage of the fair market value that is determined by local assessors to be the total taxable value of land and additions on the property. | Land | Improvement |
|---|---|---|---|---|
| 2024 | $1,681 | $52,820 | $7,350 | $45,470 |
| 2023 | $1,681 | $52,820 | $7,350 | $45,470 |
| 2022 | $1,715 | $42,240 | $6,240 | $36,000 |
| 2021 | $1,442 | $42,240 | $6,240 | $36,000 |
| 2020 | $1,454 | $42,240 | $6,240 | $36,000 |
| 2019 | $1,433 | $40,240 | $5,950 | $34,290 |
| 2018 | $1,385 | $40,240 | $5,950 | $34,290 |
| 2017 | $1,330 | $40,240 | $5,950 | $34,290 |
| 2016 | $1,304 | $38,370 | $5,780 | $32,590 |
| 2015 | $1,319 | $38,370 | $5,780 | $32,590 |
| 2013 | $1,322 | $38,510 | $5,590 | $32,920 |
| 2012 | $1,345 | $38,510 | $5,590 | $32,920 |
Source: Public Records
Map
Nearby Homes
- 10355 Ohio 279
- 2080 Cozy Glenn Rd
- 1337 Ohio 140
- 349 S Park Ave
- 321 W Main St
- 49 Twp Rd 2974
- 2006 Ohio 279
- 703 E Main St
- 25009 Ohio 93
- 413 Gallipolis Rd
- 413 Gallipolis Rd Unit (Clearview Pond)
- 25009 State Route 93
- 509 Homer Lewis Rd
- 13916 State Route 279
- 15253 Ohio 140
- 3240 Gallipolis Rd
- 1045 Sardis Rd
- 275 Horton Sisters Rd
- 3252 Sardis Rd
- 251 Wastier Cherrington Rd
- 79 Hickory Rd
- 1926 Monroe Hickory Rd
- 124 Boyd Burke Rd
- 135 Hickory Rd
- 1483 Monroe Hickory Rd
- 1794 Monroe Hickory Rd
- 2068 Monroe Hickory Rd
- 453 Boyd Burke Rd
- 1321 Monroe Hickory Rd
- 1219 Monroe Hickory Rd
- 0 Monroe Hickory Rd
- 2436 Monroe Hickory Rd
- 1065 Monroe Hickory Rd
- 1175 Monroe Hickory Rd
- 2499 Monroe Hickory Rd
- 1035 Monroe Hickory Rd
- 430 Wilford Coon Rd
- 1003 Monroe Hickory Rd
- 299 Wilford Coon Rd
- 989 Monroe Hickory Rd