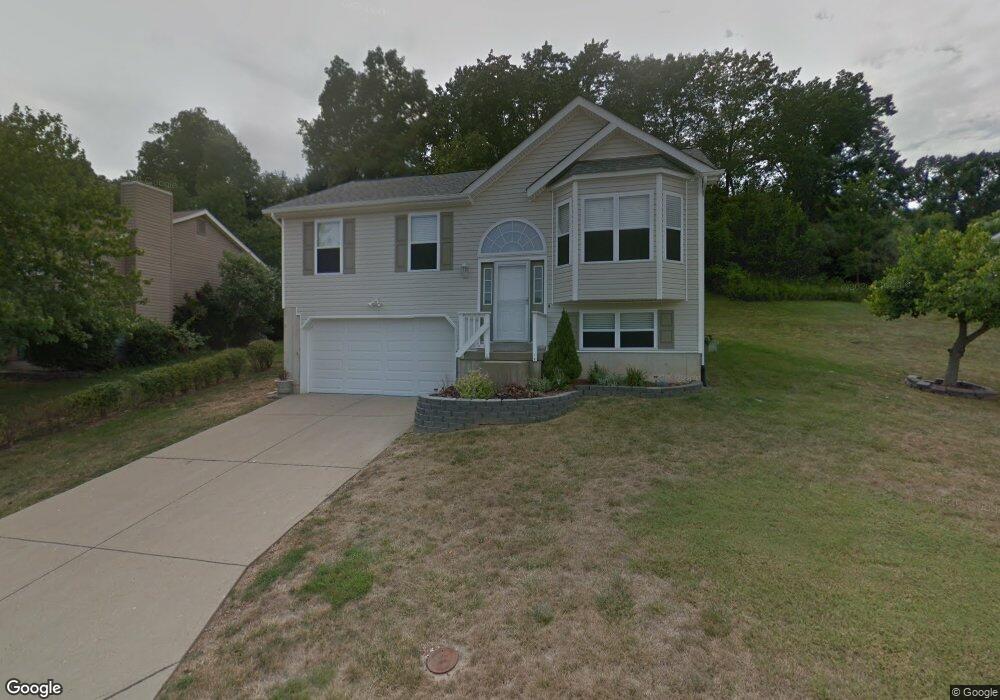
1750 Primrose Ln Barnhart, MO 63012
Estimated Value: $241,000 - $296,000
3
Beds
2
Baths
988
Sq Ft
$272/Sq Ft
Est. Value
About This Home
This home is located at 1750 Primrose Ln, Barnhart, MO 63012 and is currently estimated at $268,434, approximately $271 per square foot. 1750 Primrose Ln is a home located in Jefferson County with nearby schools including Windsor High School and St. Joseph Catholic School.
Ownership History
Date
Name
Owned For
Owner Type
Purchase Details
Closed on
Jan 23, 2013
Sold by
Scott Jeremy and Scott Jamie
Bought by
Scott Jeremy and Scott Jamie
Current Estimated Value
Home Financials for this Owner
Home Financials are based on the most recent Mortgage that was taken out on this home.
Original Mortgage
$145,500
Outstanding Balance
$102,946
Interest Rate
3.75%
Mortgage Type
FHA
Estimated Equity
$165,488
Purchase Details
Closed on
Jun 25, 2009
Sold by
Robinson Kenneth M and Robinson Katrina L
Bought by
Scott Jeremy and Lickenbrock Jamie
Home Financials for this Owner
Home Financials are based on the most recent Mortgage that was taken out on this home.
Original Mortgage
$149,246
Interest Rate
4.84%
Mortgage Type
FHA
Purchase Details
Closed on
Apr 16, 2004
Sold by
Reynolds Richard A and Reynolds Amy L
Bought by
Robinson Kenneth M and Robinson Katrina L
Home Financials for this Owner
Home Financials are based on the most recent Mortgage that was taken out on this home.
Original Mortgage
$148,087
Interest Rate
5.42%
Mortgage Type
VA
Create a Home Valuation Report for This Property
The Home Valuation Report is an in-depth analysis detailing your home's value as well as a comparison with similar homes in the area
Home Values in the Area
Average Home Value in this Area
Purchase History
| Date | Buyer | Sale Price | Title Company |
|---|---|---|---|
| Scott Jeremy | -- | None Available | |
| Scott Jeremy | -- | Ust | |
| Robinson Kenneth M | -- | -- |
Source: Public Records
Mortgage History
| Date | Status | Borrower | Loan Amount |
|---|---|---|---|
| Open | Scott Jeremy | $145,500 | |
| Closed | Scott Jeremy | $149,246 | |
| Previous Owner | Robinson Kenneth M | $148,087 |
Source: Public Records
Tax History
| Year | Tax Paid | Tax Assessment Tax Assessment Total Assessment is a certain percentage of the fair market value that is determined by local assessors to be the total taxable value of land and additions on the property. | Land | Improvement |
|---|---|---|---|---|
| 2025 | $2,345 | $34,500 | $7,700 | $26,800 |
| 2024 | $2,345 | $32,000 | $7,700 | $24,300 |
| 2023 | $2,345 | $32,000 | $7,700 | $24,300 |
| 2022 | $2,128 | $29,100 | $4,800 | $24,300 |
| 2021 | $2,130 | $29,100 | $4,800 | $24,300 |
| 2020 | $1,953 | $25,900 | $4,200 | $21,700 |
| 2019 | $1,951 | $25,900 | $4,200 | $21,700 |
| 2018 | $1,925 | $25,900 | $4,200 | $21,700 |
| 2017 | $1,851 | $25,900 | $4,200 | $21,700 |
| 2016 | $1,715 | $23,900 | $4,000 | $19,900 |
Source: Public Records
Map
Nearby Homes
- 7406 Avondale Park
- 7511 Hillcress Ct
- 1702 Springbrook Dr
- 7255 Meriwether Ct
- 2149 Meadow Dr
- 1433 Hoover Dr
- 0 Hwy Mm Unit MAR24032005
- 8147 Murphy Ln
- 1660 Old State Road M
- 8018 Fox Hollow
- 0 New Highway M Unit MAR25024234
- 1675 Old State Road M
- 36 Huntleigh Woods
- 1299 Riesling Ln
- 900 Bluff Rd
- 1692 Juanita Dr
- 1441 Megan Heights
- 6759 Sycamore Landing
- 514 Jackson Way
- 525 Jackson Way
- 1742 Primrose Ln
- 1756 Primrose Ln
- 1745 Primrose Ln
- 1753 Primrose Ln
- 1736 Primrose Ln
- 1739 Primrose Ln
- 1755 Primrose Ln
- 1762 Primrose Ln
- 7401 Avondale Park
- 1761 Primrose Ln
- 1733 Primrose Ln
- 1730 Primrose Ln
- 7680 Meadowbrook Ln
- 1752 Bayberry Ln
- 1740 Bayberry Ln
- 1746 Bayberry Ln
- 1758 Bayberry Ln
- 1767 Primrose Ln
- 1727 Primrose Ln
- 1766 Bayberry Ln
Your Personal Tour Guide
Ask me questions while you tour the home.