17506 Freymuth Rd Wapakoneta, OH 45895
Estimated Value: $307,000 - $403,482
3
Beds
3
Baths
1,512
Sq Ft
$238/Sq Ft
Est. Value
About This Home
This home is located at 17506 Freymuth Rd, Wapakoneta, OH 45895 and is currently estimated at $359,371, approximately $237 per square foot. 17506 Freymuth Rd is a home located in Auglaize County with nearby schools including Cridersville Elementary School, Wapakoneta High School, and Wapakoneta Middle School.
Ownership History
Date
Name
Owned For
Owner Type
Purchase Details
Closed on
Aug 15, 2022
Sold by
Lotz Michael W
Bought by
Dobie Devon M and Dobie Amanda M
Current Estimated Value
Home Financials for this Owner
Home Financials are based on the most recent Mortgage that was taken out on this home.
Original Mortgage
$270,000
Outstanding Balance
$255,322
Interest Rate
4.25%
Mortgage Type
Balloon
Estimated Equity
$104,049
Purchase Details
Closed on
Sep 1, 2011
Sold by
Hornig Michelle M and Lotz Michelle M
Bought by
Lotz Michael W and The Michael W Lotz Revocable Living Trus
Purchase Details
Closed on
Jun 14, 2011
Sold by
Lotz Michelle M and Hornig Michelle M
Bought by
Lotz Michael W
Purchase Details
Closed on
Aug 31, 2010
Sold by
Hornig Chad
Bought by
Lotz Michelle M and Horni Michelle M
Create a Home Valuation Report for This Property
The Home Valuation Report is an in-depth analysis detailing your home's value as well as a comparison with similar homes in the area
Home Values in the Area
Average Home Value in this Area
Purchase History
| Date | Buyer | Sale Price | Title Company |
|---|---|---|---|
| Dobie Devon M | -- | None Listed On Document | |
| Dobie Devon M | $340,000 | Brock T Blain | |
| Lotz Michael W | $179,000 | None Available | |
| Lotz Michael W | -- | Attorney | |
| Lotz Michelle M | -- | Attorney |
Source: Public Records
Mortgage History
| Date | Status | Borrower | Loan Amount |
|---|---|---|---|
| Open | Dobie Devon M | $270,000 | |
| Closed | Dobie Devon M | $270,000 |
Source: Public Records
Tax History Compared to Growth
Tax History
| Year | Tax Paid | Tax Assessment Tax Assessment Total Assessment is a certain percentage of the fair market value that is determined by local assessors to be the total taxable value of land and additions on the property. | Land | Improvement |
|---|---|---|---|---|
| 2024 | $5,559 | $111,750 | $21,050 | $90,700 |
| 2023 | $1,862 | $111,750 | $21,050 | $90,700 |
| 2022 | $2,237 | $61,510 | $14,380 | $47,130 |
| 2021 | $1,982 | $61,510 | $14,380 | $47,130 |
| 2020 | $1,014 | $61,506 | $14,378 | $47,128 |
| 2019 | $2,101 | $61,506 | $14,378 | $47,128 |
| 2018 | $2,119 | $61,506 | $14,378 | $47,128 |
| 2017 | $2,114 | $61,506 | $14,378 | $47,128 |
| 2016 | $1,988 | $56,805 | $13,692 | $43,113 |
| 2015 | $1,986 | $56,805 | $13,692 | $43,113 |
| 2014 | $1,968 | $56,805 | $13,692 | $43,113 |
| 2013 | $1,955 | $56,805 | $13,692 | $43,113 |
Source: Public Records
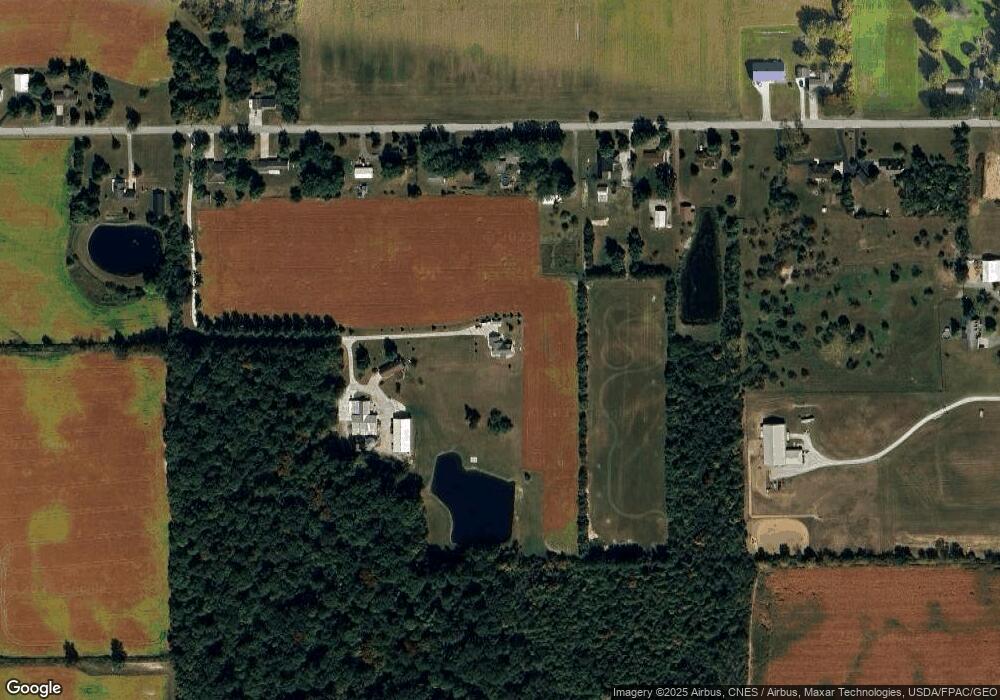
Map
Nearby Homes
- 17946 National Rd
- 212 S Oak St
- 18609 County Road 25a
- 5290 New Haven Dr
- 1805 Huntington Dr
- 1835 Huntington Dr
- 311 Marcella Ln
- 310 W Main St
- 0 Ohio 67
- 37 N Main St
- 17 E Walnut St
- 2638 Summer Rambo Ct
- 2648 Summer Rambo Ct
- 2613 Jonathon Dr
- 2691 Jonathan Dr
- 301 Muskingum Trail
- 17092 Hauss Rd
- 1643 W Breese Rd Unit 73
- 1934 Jo Jean Rd
- 20630 State Route 67
- 17504 Freymuth Rd
- 17682 Freymuth Rd
- 17657 Freymuth Rd
- 17612 Freymuth Rd
- 17782 Freymuth Rd
- 17575 Freymuth Rd
- 17774 Freymuth Rd
- 17548 Freymuth Rd
- 17514 Freymuth Rd
- 17561 Freymuth Rd
- 17864 Freymuth Rd
- 17452 Freymuth Rd
- 17859 Freymuth Rd
- 17859 Freymuth Rd
- 17896 Freymuth Rd
- 19363 Town Line-Lima Rd
- 19363 Townline-Lima Rd
- 17419 Freymuth Rd
- 17945 Freymuth Rd