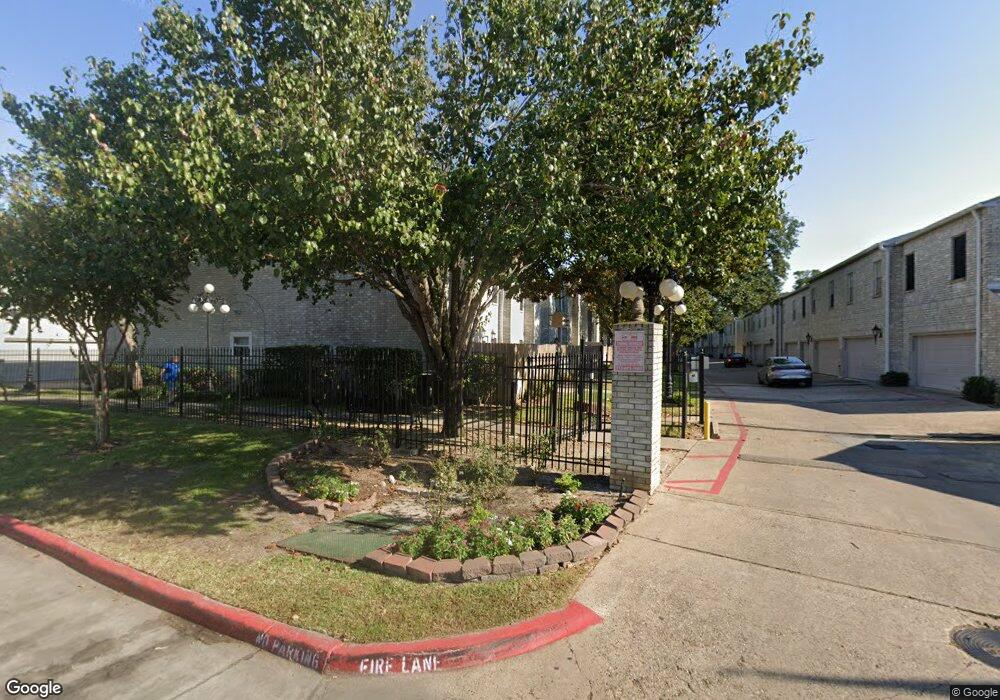
17507 Red Oak Dr Unit 7507 Houston, TX 77090
Champions NeighborhoodEstimated Value: $111,354 - $142,000
2
Beds
3
Baths
1,640
Sq Ft
$80/Sq Ft
Est. Value
About This Home
This home is located at 17507 Red Oak Dr Unit 7507, Houston, TX 77090 and is currently estimated at $130,589, approximately $79 per square foot. 17507 Red Oak Dr Unit 7507 is a home located in Harris County with nearby schools including Bammel Elementary School, Edwin M. Wells Middle School, and Westfield High School.
Ownership History
Date
Name
Owned For
Owner Type
Purchase Details
Closed on
Jul 22, 2011
Sold by
Hardin Candace
Bought by
Johnson Brandon
Current Estimated Value
Purchase Details
Closed on
Jun 2, 2000
Sold by
Foster Jan Russell and Foster Janette L
Bought by
Hardin Candace
Home Financials for this Owner
Home Financials are based on the most recent Mortgage that was taken out on this home.
Original Mortgage
$69,350
Interest Rate
8.17%
Purchase Details
Closed on
Jul 29, 1994
Sold by
Pearson Michael D and Pearson Carla F
Bought by
Anderson Jay P and Anderson Lisa L
Home Financials for this Owner
Home Financials are based on the most recent Mortgage that was taken out on this home.
Original Mortgage
$59,160
Interest Rate
8.45%
Mortgage Type
Assumption
Purchase Details
Closed on
Jan 31, 1977
Sold by
Anderson Jay P and Anderson Lisa L
Bought by
Foster Jaun Russell and Foster Janette L
Create a Home Valuation Report for This Property
The Home Valuation Report is an in-depth analysis detailing your home's value as well as a comparison with similar homes in the area
Home Values in the Area
Average Home Value in this Area
Purchase History
| Date | Buyer | Sale Price | Title Company |
|---|---|---|---|
| Johnson Brandon | -- | First American Title | |
| Hardin Candace | -- | Texas American Title Company | |
| Anderson Jay P | -- | -- | |
| Foster Jaun Russell | -- | Texas American Title Company |
Source: Public Records
Mortgage History
| Date | Status | Borrower | Loan Amount |
|---|---|---|---|
| Previous Owner | Hardin Candace | $69,350 | |
| Previous Owner | Anderson Jay P | $59,160 |
Source: Public Records
Tax History Compared to Growth
Tax History
| Year | Tax Paid | Tax Assessment Tax Assessment Total Assessment is a certain percentage of the fair market value that is determined by local assessors to be the total taxable value of land and additions on the property. | Land | Improvement |
|---|---|---|---|---|
| 2025 | $1,561 | $137,537 | $26,132 | $111,405 |
| 2024 | $1,561 | $137,537 | $26,132 | $111,405 |
| 2023 | $1,561 | $134,408 | $25,538 | $108,870 |
| 2022 | $2,599 | $119,245 | $22,657 | $96,588 |
| 2021 | $2,427 | $105,204 | $19,989 | $85,215 |
| 2020 | $2,587 | $105,204 | $19,989 | $85,215 |
| 2019 | $2,471 | $96,556 | $18,346 | $78,210 |
| 2018 | $2,611 | $86,454 | $16,426 | $70,028 |
| 2017 | $2,181 | $86,454 | $16,426 | $70,028 |
| 2016 | $2,064 | $81,826 | $15,547 | $66,279 |
| 2015 | $1,681 | $64,888 | $12,329 | $52,559 |
| 2014 | $1,681 | $65,491 | $12,443 | $53,048 |
Source: Public Records
Map
Nearby Homes
- 17585 Red Oak Dr Unit 7585
- 17591 Red Oak Dr Unit 7591
- 17583 Red Oak Dr Unit 7583
- 17471 Red Oak Dr Unit 7471
- 17481 Red Oak Dr Unit 7481
- 17597 Red Oak Dr Unit 7597
- 17631 Red Oak Dr Unit 7631
- 17401 Red Oak Dr Unit 102
- 17331 Red Oak Dr Unit 22
- 17331 Red Oak Dr Unit 36
- 17331 Red Oak Dr Unit 26
- 17331 Red Oak Dr Unit 38
- 17331 Red Oak Dr Unit 14
- 17331 Red Oak Dr Unit 8
- 17331 Red Oak Dr Unit D 34
- 811 Loire Ln
- 1103 Suwanee Ln
- 1118 Marne Ln
- 1011 Baltic Ln
- 1114 Manatee Ln
- 17511 Red Oak Dr Unit 7511
- 17513 Red Oak Dr Unit 7513
- 17551 Red Oak Dr Unit 7551
- 17549 Red Oak Dr Unit 7549
- 17515 Red Oak Dr Unit 7515
- 17503 Red Oak Dr Unit 7503
- 17501 Red Oak Dr Unit 7501
- 17501 Red Oak Dr Unit 17501
- 17547 Red Oak Dr Unit 7547
- 17611 Red Oak Dr Unit 7611
- 17505 Red Oak Dr Unit 7505
- 17555 Red Oak Dr Unit 7555
- 17419 Red Oak Dr Unit 7419
- 17565 Red Oak Dr Unit 7565
- 17587 Red Oak Dr Unit 7587
- 17567 Red Oak Dr Unit 7567
- 17509 Red Oak Dr Unit 7509
- 17519 Red Oak Dr Unit 7519
- 17523 Red Oak Dr Unit 7523
- 17563 Red Oak Dr Unit 7563