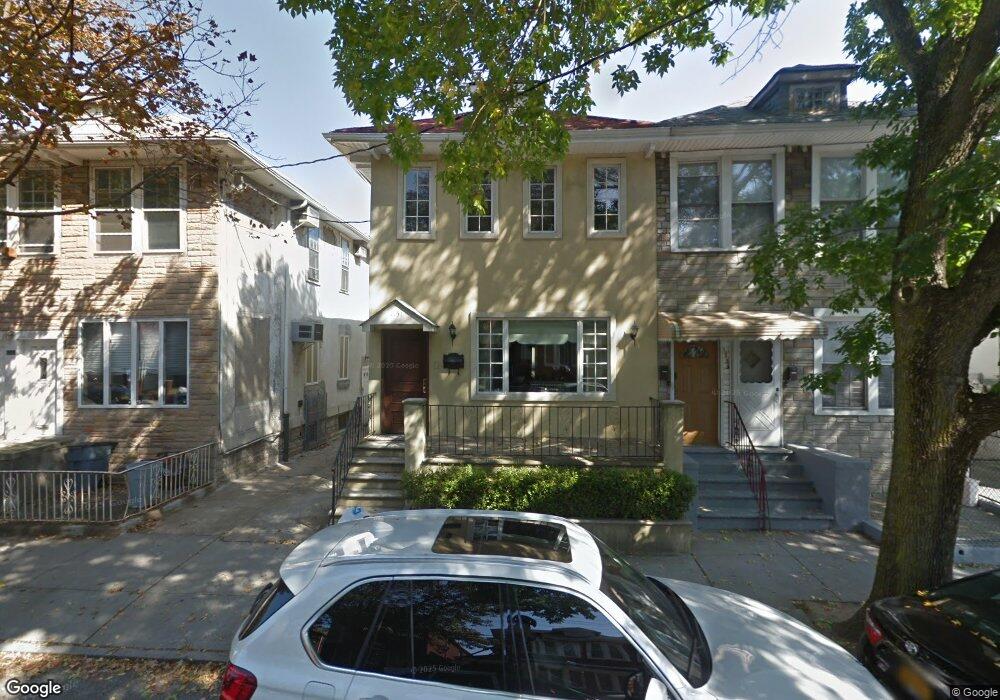
1751 E 10th St Brooklyn, NY 11223
Homecrest NeighborhoodEstimated Value: $1,741,000 - $2,617,118
--
Bed
--
Bath
2,480
Sq Ft
$822/Sq Ft
Est. Value
About This Home
This home is located at 1751 E 10th St, Brooklyn, NY 11223 and is currently estimated at $2,038,780, approximately $822 per square foot. 1751 E 10th St is a home located in Kings County with nearby schools including P.S. 238 - Anne Sullivan, Abraham Lincoln High School, and Yeshiva Bais Chaya Esther.
Ownership History
Date
Name
Owned For
Owner Type
Purchase Details
Closed on
Aug 28, 2023
Sold by
Jemal Samuel S and Jemal Victoria
Bought by
Jemal Trustee Samuel S and Jemal Trustee Victoria
Current Estimated Value
Purchase Details
Closed on
Mar 23, 2021
Sold by
Barnathan Shirley
Bought by
Jemal Samuel Steven and Jemal Victoria
Purchase Details
Closed on
May 8, 2002
Sold by
Nelkenbaum Yisroel
Bought by
Barnathan Joseph and Barnathan Shirley
Home Financials for this Owner
Home Financials are based on the most recent Mortgage that was taken out on this home.
Original Mortgage
$230,000
Interest Rate
7.01%
Mortgage Type
Purchase Money Mortgage
Purchase Details
Closed on
Nov 2, 2001
Sold by
Wolfson Thomas
Bought by
Nelkenbaum Yisroel
Home Financials for this Owner
Home Financials are based on the most recent Mortgage that was taken out on this home.
Original Mortgage
$232,000
Interest Rate
6.6%
Mortgage Type
Purchase Money Mortgage
Purchase Details
Closed on
Nov 8, 1996
Sold by
Meyers Ruth
Bought by
Wolfson Thomas
Create a Home Valuation Report for This Property
The Home Valuation Report is an in-depth analysis detailing your home's value as well as a comparison with similar homes in the area
Home Values in the Area
Average Home Value in this Area
Purchase History
| Date | Buyer | Sale Price | Title Company |
|---|---|---|---|
| Jemal Trustee Samuel S | -- | -- | |
| Jemal Samuel Steven | $1,725,000 | -- | |
| Barnathan Joseph | -- | -- | |
| Nelkenbaum Yisroel | -- | -- | |
| Wolfson Thomas | -- | First American Title Ins Co |
Source: Public Records
Mortgage History
| Date | Status | Borrower | Loan Amount |
|---|---|---|---|
| Previous Owner | Barnathan Joseph | $230,000 | |
| Previous Owner | Nelkenbaum Yisroel | $232,000 |
Source: Public Records
Tax History Compared to Growth
Tax History
| Year | Tax Paid | Tax Assessment Tax Assessment Total Assessment is a certain percentage of the fair market value that is determined by local assessors to be the total taxable value of land and additions on the property. | Land | Improvement |
|---|---|---|---|---|
| 2025 | $9,413 | $116,220 | $21,960 | $94,260 |
| 2024 | $9,413 | $97,380 | $21,960 | $75,420 |
| 2023 | $8,994 | $108,960 | $21,960 | $87,000 |
| 2022 | $8,411 | $99,180 | $21,960 | $77,220 |
| 2021 | $8,709 | $82,560 | $21,960 | $60,600 |
| 2020 | $8,709 | $83,460 | $21,960 | $61,500 |
| 2019 | $8,170 | $66,360 | $21,960 | $44,400 |
| 2018 | $7,523 | $36,903 | $9,169 | $27,734 |
| 2017 | $7,158 | $35,112 | $9,810 | $25,302 |
| 2016 | $6,894 | $34,485 | $13,012 | $21,473 |
| 2015 | $3,995 | $32,546 | $11,345 | $21,201 |
| 2014 | $3,995 | $32,546 | $12,581 | $19,965 |
Source: Public Records
Map
Nearby Homes
- 1788 E 10th St
- 1753 E 12 St Unit PH3
- 1761 E 12th St
- 1753 E 12th St Unit PH3
- 1801 E 7th St
- 1855 E 12th St Unit 4M
- 1855 E 12th St Unit 6J
- 1811 Ocean Pkwy Unit 6M
- 1811 Ocean Pkwy Unit 6L
- 1670 E 8th St
- 1654 E 10th St
- 1769 E 13th St Unit 2B
- 1769 E 13th St Unit 4B
- 1730 E 14th St Unit 5K
- 1730 E 14th St Unit 4K
- 1730 E 14th St Unit 6J
- 1847 E 13th St
- 1800 Ocean Pkwy Unit E11
- 1727 E 14th St
- 1734 E 7th St
- 1753 E 10th St
- 1747 E 10th St
- 1757 E 10th St
- 1745 E 10th St
- 1759 E 10th St
- 1741 E 10th St
- 1763 E 10th St
- 2082 Coney Island Ave
- 2084 Coney Island Ave
- 2086 Coney Island Ave
- 2080 Coney Island Ave
- 1765 E 10th St
- 2092 Coney Island Ave
- 934 Kings Hwy
- 938-942 Kings Hwy
- 1750 E 10th St
- 1746 E 10th St
- 1769 E 10th St
- 950 Kings Hwy
- 1752 E 10th St