Estimated Value: $160,787 - $186,000
--
Bed
1
Bath
1,043
Sq Ft
$168/Sq Ft
Est. Value
About This Home
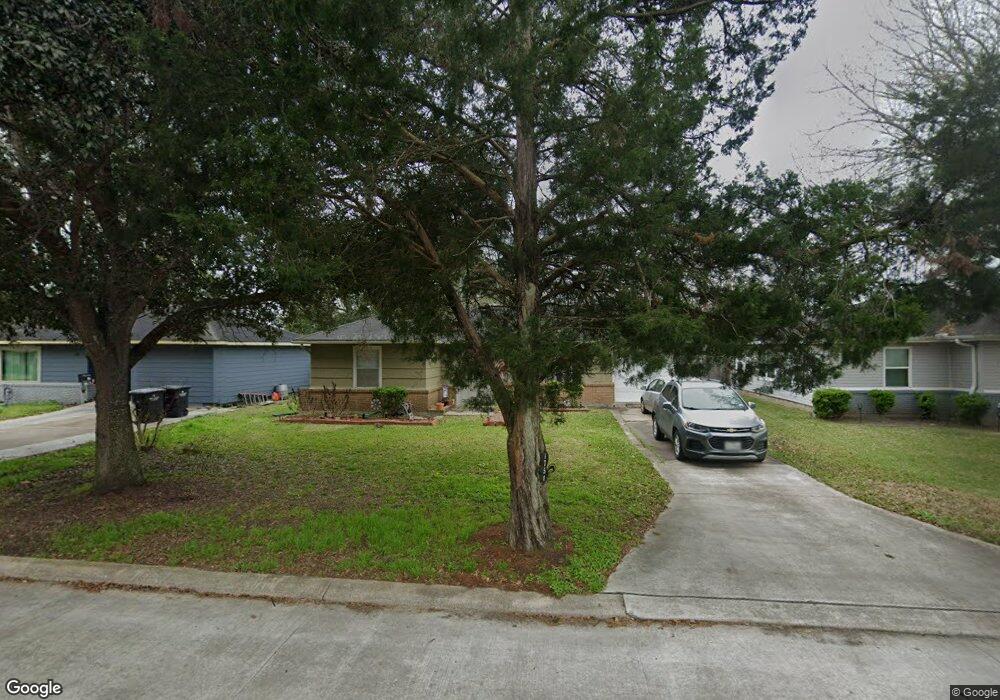
This home is located at 1751 S Park Dr, Alvin, TX 77511 and is currently estimated at $175,697, approximately $168 per square foot. 1751 S Park Dr is a home located in Brazoria County with nearby schools including Alvin Elementary School, Alvin Junior High School, and Alvin High School.
Ownership History
Date
Name
Owned For
Owner Type
Purchase Details
Closed on
Apr 6, 2010
Sold by
Moore Dena
Bought by
Moore Jeffrey
Current Estimated Value
Purchase Details
Closed on
May 22, 1996
Sold by
Webb Bobby H and Reyes Andy A
Bought by
Moore Jeffrey P and Moore Dena D
Home Financials for this Owner
Home Financials are based on the most recent Mortgage that was taken out on this home.
Original Mortgage
$47,955
Outstanding Balance
$2,747
Interest Rate
8.06%
Mortgage Type
FHA
Estimated Equity
$172,950
Create a Home Valuation Report for This Property
The Home Valuation Report is an in-depth analysis detailing your home's value as well as a comparison with similar homes in the area
Home Values in the Area
Average Home Value in this Area
Purchase History
| Date | Buyer | Sale Price | Title Company |
|---|---|---|---|
| Moore Jeffrey | -- | None Available | |
| Moore Jeffrey P | -- | -- |
Source: Public Records
Mortgage History
| Date | Status | Borrower | Loan Amount |
|---|---|---|---|
| Open | Moore Jeffrey P | $47,955 |
Source: Public Records
Tax History Compared to Growth
Tax History
| Year | Tax Paid | Tax Assessment Tax Assessment Total Assessment is a certain percentage of the fair market value that is determined by local assessors to be the total taxable value of land and additions on the property. | Land | Improvement |
|---|---|---|---|---|
| 2025 | $2,132 | $160,480 | $23,630 | $136,850 |
| 2023 | $2,132 | $134,237 | $23,630 | $138,570 |
| 2022 | $3,347 | $122,034 | $23,630 | $112,460 |
| 2021 | $3,203 | $110,940 | $15,220 | $95,720 |
| 2020 | $3,109 | $110,940 | $15,220 | $95,720 |
| 2019 | $2,901 | $96,580 | $11,030 | $85,550 |
| 2018 | $2,751 | $96,580 | $11,030 | $85,550 |
| 2017 | $2,532 | $83,100 | $11,030 | $72,070 |
| 2016 | $2,322 | $78,980 | $11,030 | $67,950 |
| 2015 | $1,620 | $76,590 | $11,030 | $65,560 |
| 2014 | $1,620 | $62,990 | $11,030 | $51,960 |
Source: Public Records
Map
Nearby Homes
- 208 W Jordan St
- 1813 Meadowview Dr
- 225 Foster St
- 1216 S Hill St
- 1001 Rosharon Rd
- 319 E South St
- 1174 Filly Creek Dr
- 1302 Cypress St
- 1188 Filly Creek Dr
- 1020 S Booth Ln
- 1012 S Lee St
- 914 S Hill St
- 222 E Southland Ave
- 1197 Cavalry Junction Dr
- 1279 Pinto Pass
- 1211 Quarterhorse Dr
- 304 E Foley St
- 209 E Foley St
- 1193 Stallion Ridge
- 710 S Jackson St
- 1753 S Park Dr
- 1749 S Park Dr
- 1749 South Park
- 1747 S Park Dr
- 1755 S Park Dr
- 1707 Glenview Dr
- 1709 Glenview Dr
- 1750 S Park Dr
- 1748 S Park Dr
- 1752 S Park Dr
- 1711 Glenview Dr
- 1705 Glenview Dr
- 1757 S Park Dr
- 1745 S Park Dr
- 1754 S Park Dr
- 1746 S Park Dr
- 1713 Glenview Dr
- 1744 S Park Dr
- 1756 S Park Dr
- 1743 S Park Dr