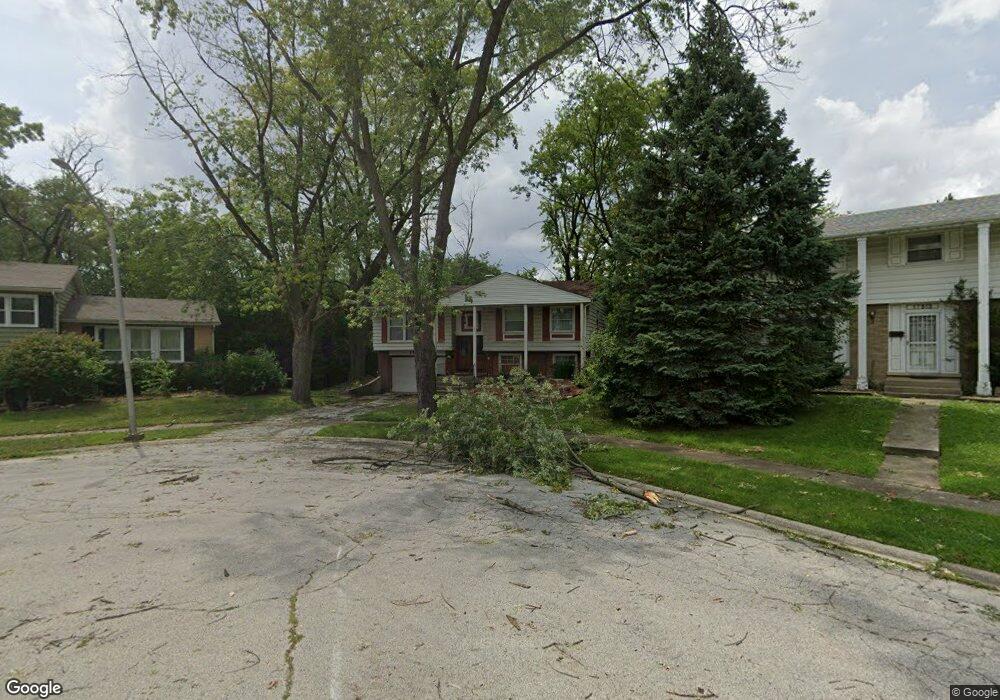
17514 Butternut Rd Hazel Crest, IL 60429
Stonebridge NeighborhoodEstimated Value: $216,000 - $270,000
3
Beds
2
Baths
1,178
Sq Ft
$200/Sq Ft
Est. Value
About This Home
This home is located at 17514 Butternut Rd, Hazel Crest, IL 60429 and is currently estimated at $235,585, approximately $199 per square foot. 17514 Butternut Rd is a home located in Cook County with nearby schools including Willow Elementary School, Winston Churchill School, and James Hart School.
Ownership History
Date
Name
Owned For
Owner Type
Purchase Details
Closed on
May 7, 2004
Sold by
Hud
Bought by
Doh Paula
Current Estimated Value
Home Financials for this Owner
Home Financials are based on the most recent Mortgage that was taken out on this home.
Original Mortgage
$104,080
Outstanding Balance
$58,539
Interest Rate
8.8%
Mortgage Type
Unknown
Estimated Equity
$177,046
Purchase Details
Closed on
Aug 27, 2003
Sold by
Allo Christopher
Bought by
Hud
Purchase Details
Closed on
Jul 31, 2000
Sold by
Lawrence Terese M and Riley William
Bought by
Allo Christopher
Home Financials for this Owner
Home Financials are based on the most recent Mortgage that was taken out on this home.
Original Mortgage
$119,050
Interest Rate
8.16%
Mortgage Type
FHA
Purchase Details
Closed on
Jan 7, 1998
Sold by
Lawrence Gregory V
Bought by
Lawrence Terese M and Riley William
Home Financials for this Owner
Home Financials are based on the most recent Mortgage that was taken out on this home.
Original Mortgage
$50,000
Interest Rate
7.14%
Create a Home Valuation Report for This Property
The Home Valuation Report is an in-depth analysis detailing your home's value as well as a comparison with similar homes in the area
Home Values in the Area
Average Home Value in this Area
Purchase History
| Date | Buyer | Sale Price | Title Company |
|---|---|---|---|
| Doh Paula | -- | Stewart Title Of Illinois | |
| Hud | -- | -- | |
| Allo Christopher | $120,000 | First American Title | |
| Lawrence Terese M | -- | -- |
Source: Public Records
Mortgage History
| Date | Status | Borrower | Loan Amount |
|---|---|---|---|
| Open | Doh Paula | $104,080 | |
| Previous Owner | Allo Christopher | $119,050 | |
| Previous Owner | Lawrence Terese M | $50,000 |
Source: Public Records
Tax History
| Year | Tax Paid | Tax Assessment Tax Assessment Total Assessment is a certain percentage of the fair market value that is determined by local assessors to be the total taxable value of land and additions on the property. | Land | Improvement |
|---|---|---|---|---|
| 2025 | $8,664 | $19,000 | $6,471 | $12,529 |
| 2024 | $8,664 | $19,000 | $6,471 | $12,529 |
| 2023 | $5,391 | $19,000 | $6,471 | $12,529 |
| 2022 | $5,391 | $10,657 | $5,709 | $4,948 |
| 2021 | $5,141 | $10,657 | $5,709 | $4,948 |
| 2020 | $5,001 | $10,657 | $5,709 | $4,948 |
| 2019 | $3,913 | $9,178 | $5,328 | $3,850 |
| 2018 | $3,740 | $9,178 | $5,328 | $3,850 |
| 2017 | $4,557 | $10,628 | $5,328 | $5,300 |
| 2016 | $4,041 | $9,192 | $4,567 | $4,625 |
| 2015 | $3,874 | $9,192 | $4,567 | $4,625 |
| 2014 | $3,782 | $9,192 | $4,567 | $4,625 |
| 2013 | $4,337 | $11,070 | $4,567 | $6,503 |
Source: Public Records
Map
Nearby Homes
- 2711 Larkspur Ln
- 2722 Cherrywood Place
- 2514 Spruce Rd
- 17731 Larkspur Ln
- 17742 Larkspur Ln
- 17613 Grandview Dr
- 2900 175th St
- 17622 Oakwood Dr
- 17563 Western Ave
- 17714 Dogwood Ln
- 17803 Dogwood Ln
- 17805 Dogwood Ln
- 2912 175th St
- 5 E Carriageway Dr Unit 201
- 5 E Carriageway Dr Unit 210
- 2817 173rd St
- 7 E Carriageway Dr Unit 311
- 17804 Pebblewood Ln
- 17640 Golfview Ave
- 2908 Buttonwood Walk
- 17512 Butternut Rd
- 17516 Butternut Rd
- 17510 Butternut Rd
- 17518 Butternut Rd
- 17509 Danielle Ct
- 17508 Butternut Rd
- 2624 Turtle Creek Dr
- 2700 Turtle Creek Dr
- 2622 Turtle Creek Dr
- 17510 Danielle Ct
- 2702 Turtle Creek Dr
- 2620 Turtle Creek Dr
- 2620 Turtle Creek Dr
- 17506 Butternut Rd
- 2704 Turtle Creek Dr
- 17508 Danielle Ct
- 17504 Butternut Rd
- 17507 Butternut Rd
- 2625 Turtle Creek Dr
- 2623 Turtle Creek Dr
Your Personal Tour Guide
Ask me questions while you tour the home.