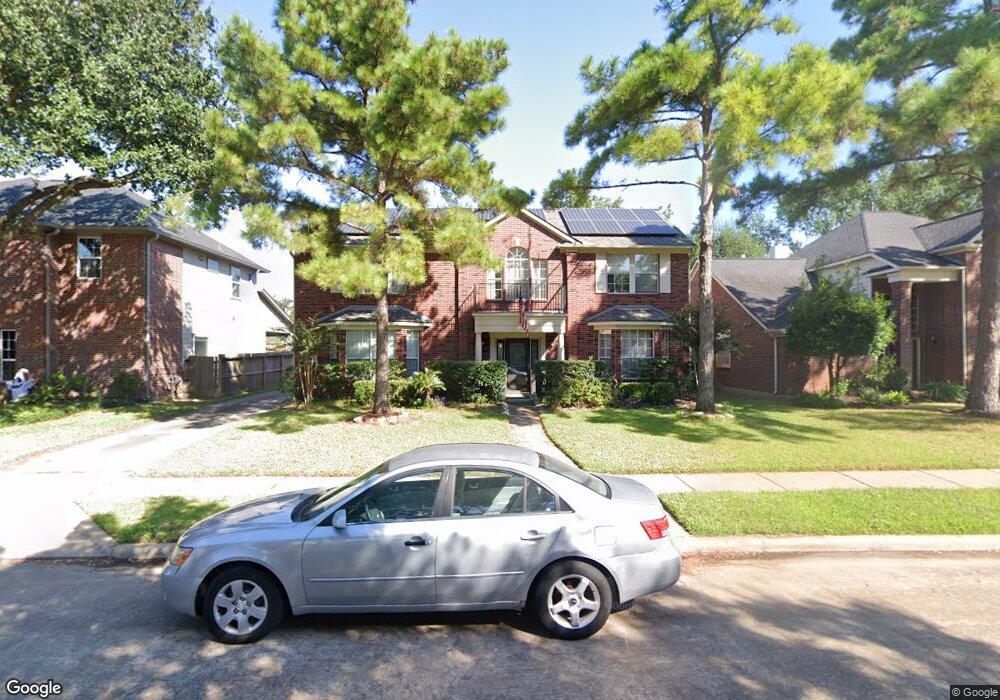
17514 Tall Maple Ct Houston, TX 77095
Copperfield NeighborhoodEstimated Value: $361,209 - $381,000
4
Beds
3
Baths
2,592
Sq Ft
$144/Sq Ft
Est. Value
About This Home
This home is located at 17514 Tall Maple Ct, Houston, TX 77095 and is currently estimated at $373,552, approximately $144 per square foot. 17514 Tall Maple Ct is a home located in Harris County with nearby schools including Copeland Elementary School, Aragon Middle School, and Langham Creek High School.
Ownership History
Date
Name
Owned For
Owner Type
Purchase Details
Closed on
Jun 15, 2009
Sold by
Vande Pol Johan Carolus and Van De Pol Diane
Bought by
Dragan Ramona F and Dragan Ioan A
Current Estimated Value
Home Financials for this Owner
Home Financials are based on the most recent Mortgage that was taken out on this home.
Original Mortgage
$156,120
Outstanding Balance
$98,266
Interest Rate
4.7%
Mortgage Type
FHA
Estimated Equity
$275,286
Purchase Details
Closed on
Dec 28, 1994
Sold by
Federal National Mortgage Association
Bought by
Vandepol Johan Carolus and Vandepol Diane
Home Financials for this Owner
Home Financials are based on the most recent Mortgage that was taken out on this home.
Original Mortgage
$94,000
Interest Rate
9.19%
Purchase Details
Closed on
Jul 20, 1994
Sold by
Ryland Mtg Company
Bought by
Federal National Mortgage Association
Create a Home Valuation Report for This Property
The Home Valuation Report is an in-depth analysis detailing your home's value as well as a comparison with similar homes in the area
Home Values in the Area
Average Home Value in this Area
Purchase History
| Date | Buyer | Sale Price | Title Company |
|---|---|---|---|
| Dragan Ramona F | -- | Star Tex Title Company | |
| Vandepol Johan Carolus | -- | -- | |
| Federal National Mortgage Association | -- | -- |
Source: Public Records
Mortgage History
| Date | Status | Borrower | Loan Amount |
|---|---|---|---|
| Open | Dragan Ramona F | $156,120 | |
| Previous Owner | Vandepol Johan Carolus | $94,000 |
Source: Public Records
Tax History Compared to Growth
Tax History
| Year | Tax Paid | Tax Assessment Tax Assessment Total Assessment is a certain percentage of the fair market value that is determined by local assessors to be the total taxable value of land and additions on the property. | Land | Improvement |
|---|---|---|---|---|
| 2025 | $4,777 | $352,004 | $68,023 | $283,981 |
| 2024 | $4,777 | $341,460 | $68,023 | $273,437 |
| 2023 | $4,777 | $340,332 | $68,023 | $272,309 |
| 2022 | $6,134 | $315,846 | $48,588 | $267,258 |
| 2021 | $5,852 | $251,432 | $48,588 | $202,844 |
| 2020 | $5,510 | $215,301 | $37,375 | $177,926 |
| 2019 | $5,503 | $210,000 | $37,375 | $172,625 |
| 2018 | $2,254 | $226,946 | $37,375 | $189,571 |
| 2017 | $5,869 | $226,946 | $37,375 | $189,571 |
| 2016 | $5,869 | $226,946 | $37,375 | $189,571 |
| 2015 | $3,725 | $220,642 | $37,375 | $183,267 |
| 2014 | $3,725 | $190,334 | $31,395 | $158,939 |
Source: Public Records
Map
Nearby Homes
- 17518 Rustling Aspen Ln
- 7806 Feather Springs Dr
- 17814 Stoney Glade Ct
- 7807 Hickory Mill Ct
- 17603 Fairgrove Park Dr
- 18002 Stoney Glade Ct
- 7626 Almond Springs Dr
- 17522 Masonridge Dr
- 17427 Pinecreek Hollow Ln
- 17214 Palm Falls Ct
- 7918 Blue Wahoo Ln
- 7838 Blue Wahoo Ln
- 7951 Barker Cypress Rd
- 8322 Morning Dawn Dr
- 17935 Western Pass Ln
- 7639 Golden Thistle Ln
- 17527 Hamilwood Dr
- 17523 Hamilwood Dr
- 8330 Morning Dawn Dr
- 8311 Brighton Lake Ln
- 17518 Tall Maple Ct
- 17510 Tall Maple Ct
- 17519 Rustling Aspen Ln
- 17523 Rustling Aspen Ln
- 17522 Tall Maple Ct
- 17506 Tall Maple Ct
- 17515 Rustling Aspen Ln
- 17515 Tall Maple Ct
- 17519 Tall Maple Ct
- 17511 Tall Maple Ct
- 17511 Rustling Aspen Ln
- 17502 Tall Maple Ct
- 17531 Rustling Aspen Ln
- 17523 Tall Maple Ct
- 17526 Tall Maple Ct
- 17507 Rustling Aspen Ln
- 17535 Rustling Aspen Ln
- 7931 Regal Spruce Ct
- 7931 Feather Springs Dr
- 17527 Tall Maple Ct