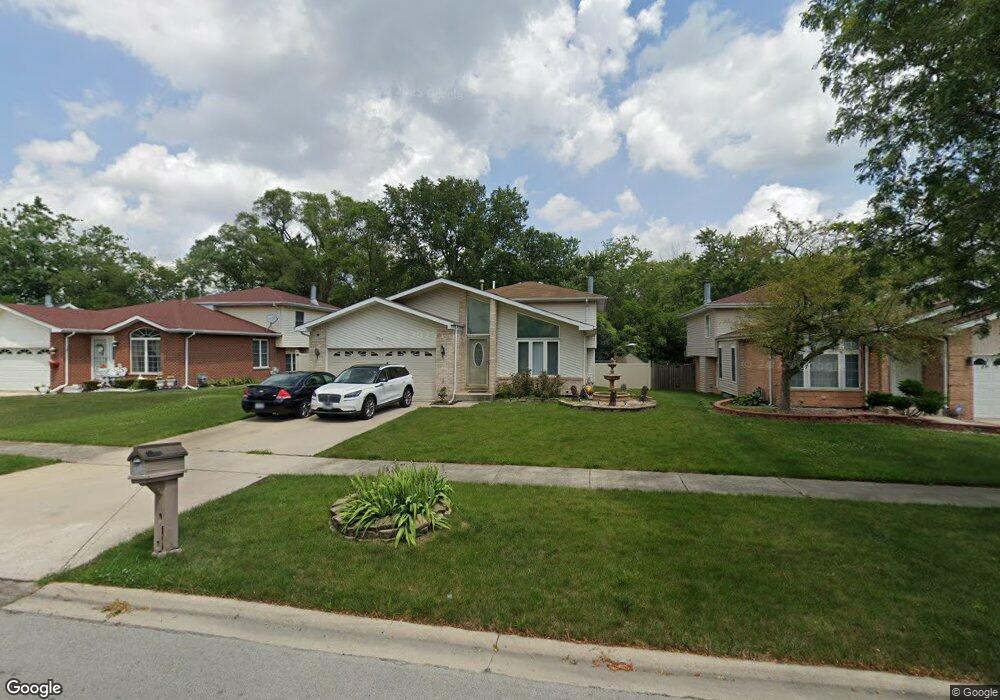
17515 Central Park Ave Hazel Crest, IL 60429
Chateaux-Versailles NeighborhoodEstimated Value: $212,000 - $351,000
4
Beds
3
Baths
1,235
Sq Ft
$219/Sq Ft
Est. Value
About This Home
This home is located at 17515 Central Park Ave, Hazel Crest, IL 60429 and is currently estimated at $270,251, approximately $218 per square foot. 17515 Central Park Ave is a home located in Cook County with nearby schools including Mae Jemison School, Prairie-Hills Junior High School, and Hillcrest High School.
Ownership History
Date
Name
Owned For
Owner Type
Purchase Details
Closed on
May 10, 2012
Sold by
Springleaf Financial Services Of Illino
Bought by
Hanson Kwasi
Current Estimated Value
Home Financials for this Owner
Home Financials are based on the most recent Mortgage that was taken out on this home.
Original Mortgage
$115,008
Outstanding Balance
$79,120
Interest Rate
3.75%
Mortgage Type
FHA
Estimated Equity
$191,131
Purchase Details
Closed on
Feb 16, 2011
Sold by
Turner Travale L
Bought by
American General Financial Services Of I
Purchase Details
Closed on
Oct 1, 2004
Sold by
Salta Group Inc
Bought by
Turner Travale and Turner Deborah
Home Financials for this Owner
Home Financials are based on the most recent Mortgage that was taken out on this home.
Original Mortgage
$166,250
Interest Rate
7.3%
Mortgage Type
Unknown
Purchase Details
Closed on
Mar 23, 2004
Sold by
Orr David D
Bought by
Salta Group Inc
Purchase Details
Closed on
Sep 15, 1995
Sold by
American National Bk & Tr Co Of Chicago
Bought by
Page Allen W
Create a Home Valuation Report for This Property
The Home Valuation Report is an in-depth analysis detailing your home's value as well as a comparison with similar homes in the area
Home Values in the Area
Average Home Value in this Area
Purchase History
| Date | Buyer | Sale Price | Title Company |
|---|---|---|---|
| Hanson Kwasi | $118,000 | Git | |
| American General Financial Services Of I | -- | None Available | |
| Turner Travale | $175,000 | Rtc | |
| Salta Group Inc | -- | -- | |
| Page Allen W | $156,000 | Intercounty Title |
Source: Public Records
Mortgage History
| Date | Status | Borrower | Loan Amount |
|---|---|---|---|
| Open | Hanson Kwasi | $115,008 | |
| Previous Owner | Turner Travale | $166,250 |
Source: Public Records
Tax History Compared to Growth
Tax History
| Year | Tax Paid | Tax Assessment Tax Assessment Total Assessment is a certain percentage of the fair market value that is determined by local assessors to be the total taxable value of land and additions on the property. | Land | Improvement |
|---|---|---|---|---|
| 2024 | $12,371 | $28,000 | $3,481 | $24,519 |
| 2023 | $8,067 | $28,000 | $3,481 | $24,519 |
| 2022 | $8,067 | $14,668 | $3,071 | $11,597 |
| 2021 | $9,126 | $16,527 | $3,071 | $13,456 |
| 2020 | $8,831 | $16,527 | $3,071 | $13,456 |
| 2019 | $7,172 | $14,404 | $2,866 | $11,538 |
| 2018 | $6,949 | $14,404 | $2,866 | $11,538 |
| 2017 | $6,526 | $14,404 | $2,866 | $11,538 |
| 2016 | $5,864 | $12,781 | $2,457 | $10,324 |
| 2015 | $5,546 | $12,781 | $2,457 | $10,324 |
| 2014 | $5,437 | $12,781 | $2,457 | $10,324 |
| 2013 | $6,163 | $15,832 | $2,457 | $13,375 |
Source: Public Records
Map
Nearby Homes
- 17640 Central Park Ave
- 17651 Hillcrest Dr
- 3617 175th Place
- 17617 Central Park Ave
- 17710 Harvard Ln
- 3651 177th St
- 17721 Sarah Ln
- 7R3 Country Club Ln
- 7R2 Country Club Ln
- 17316 Central Park Ave
- 3740 Highland Place
- 17303 Appletree Dr
- 17861 Harvard Ln
- 3761 Kirk Ct
- 3512 Woodworth Place
- 17511 Winston Dr Unit 1
- 17306 Burr Oak Ln
- 17311 Burr Oak Ln
- 17700 Springfield Ave
- 3618 Peach Grove Ln
- 17513 Central Park Ave
- 17517 Central Park Ave
- 17511 Central Park Ave
- 17519 Central Park Ave
- 17590 Central Park Ave
- 17509 Central Park Ave
- 17600 Central Park Ave
- 17521 Central Park Ave
- 17580 Central Park Ave
- 17520 Central Park Ave
- 17606 Central Park Ave Unit 4
- 17610 Central Park Ave
- 17601 Central Park Ave
- 3605 175th Place
- 17601 Hillcrest Dr
- 17620 Central Park Ave
- 3561 175th St
- 3608 176th St
- 3609 175th Place
- 17605 Hillcrest Dr