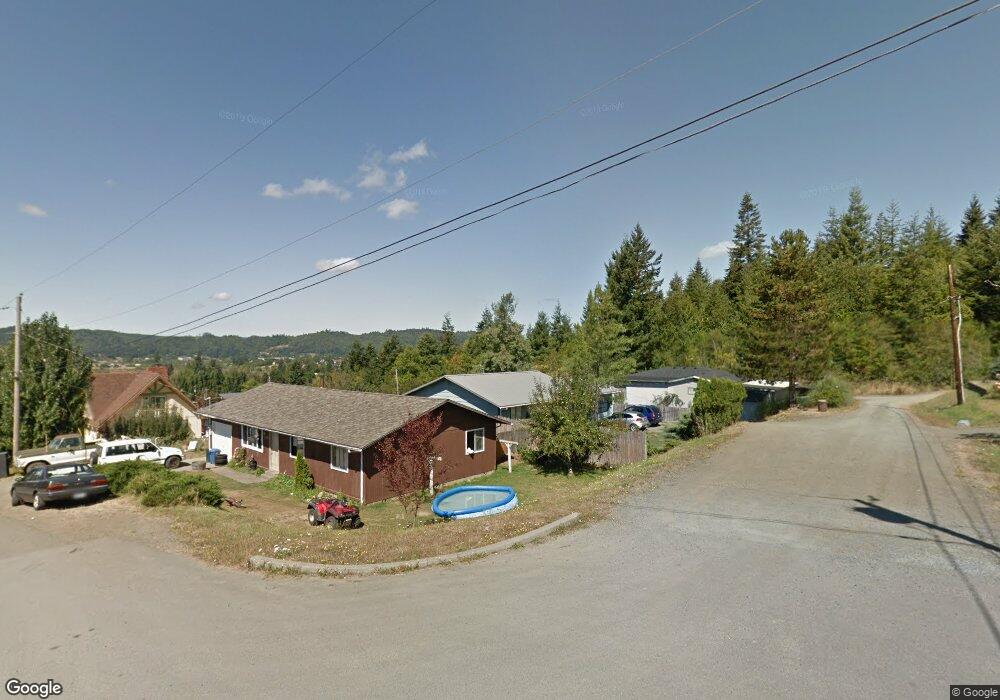
1752 22nd St Myrtle Point, OR 97458
Estimated Value: $286,490 - $297,000
3
Beds
2
Baths
1,088
Sq Ft
$268/Sq Ft
Est. Value
About This Home
This home is located at 1752 22nd St, Myrtle Point, OR 97458 and is currently estimated at $291,745, approximately $268 per square foot. 1752 22nd St is a home located in Coos County with nearby schools including Myrtle Crest School and Myrtle Point High School.
Ownership History
Date
Name
Owned For
Owner Type
Purchase Details
Closed on
Oct 31, 2023
Sold by
Nasburg Connie J
Bought by
Nasburg Connie J and Nasburg Stephen R
Current Estimated Value
Home Financials for this Owner
Home Financials are based on the most recent Mortgage that was taken out on this home.
Original Mortgage
$243,386
Interest Rate
7.44%
Mortgage Type
FHA
Purchase Details
Closed on
Jul 21, 2005
Sold by
State Of Oregon
Bought by
Vedack Connie Jo
Create a Home Valuation Report for This Property
The Home Valuation Report is an in-depth analysis detailing your home's value as well as a comparison with similar homes in the area
Home Values in the Area
Average Home Value in this Area
Purchase History
| Date | Buyer | Sale Price | Title Company |
|---|---|---|---|
| Nasburg Connie J | -- | Vantage Point Title | |
| Vedack Connie Jo | -- | -- |
Source: Public Records
Mortgage History
| Date | Status | Borrower | Loan Amount |
|---|---|---|---|
| Previous Owner | Nasburg Connie J | $243,386 |
Source: Public Records
Tax History Compared to Growth
Tax History
| Year | Tax Paid | Tax Assessment Tax Assessment Total Assessment is a certain percentage of the fair market value that is determined by local assessors to be the total taxable value of land and additions on the property. | Land | Improvement |
|---|---|---|---|---|
| 2025 | $2,372 | $143,100 | -- | -- |
| 2024 | $2,333 | $138,940 | -- | -- |
| 2023 | $2,226 | $134,900 | $0 | $0 |
| 2022 | $2,191 | $130,980 | $0 | $0 |
| 2021 | $2,134 | $127,170 | $0 | $0 |
| 2020 | $2,075 | $127,170 | $0 | $0 |
| 2019 | $1,985 | $119,880 | $0 | $0 |
| 2018 | $1,917 | $116,390 | $0 | $0 |
| 2017 | $1,880 | $113,000 | $0 | $0 |
| 2016 | $1,825 | $109,710 | $0 | $0 |
| 2015 | $1,674 | $106,520 | $0 | $0 |
| 2014 | $1,674 | $103,420 | $0 | $0 |
Source: Public Records
Map
Nearby Homes
- 1715 20th St
- 1753 20th St
- 1893 Sunset Ln
- 1861 View St
- 1783 View St
- 1985 Roseburg Rd
- 2047 Roseburg Rd
- 1938 Maryland Ave
- 1434 Maryland Ave
- 1873 E Cedar St
- 1314 Bothwick St
- 1404 Harris St
- 92433 Ward Creek Ln
- 1829 E Willow St
- 1713 Maple St
- 805 C St
- 1627 Maple St
- 1311 Willow St
- 227 Border St
- 1112 Spruce St
- 2106 King Ln
- 2110 Stover Ln
- 2080 Stover Ln
- 2030 King Ln
- 1753 22nd St
- 1725 22nd St
- 2206 King Ln
- 2105 King Ln
- 2054 Stover Ln
- 2205 King Ln
- 1826 22nd St
- 2020 King Ln
- 2041 King Ln
- 2032 Stover Ln
- 1823 22nd St
- 0 Tax Id 1142401 Unit 15663719
- 2010 King Ln
- 1834 21st St
- 1831 22nd St
- 0 Tax Id 1142402 Unit 15307318