1752 Standpipe Rd Jackson, OH 45640
Estimated Value: $224,344 - $285,000
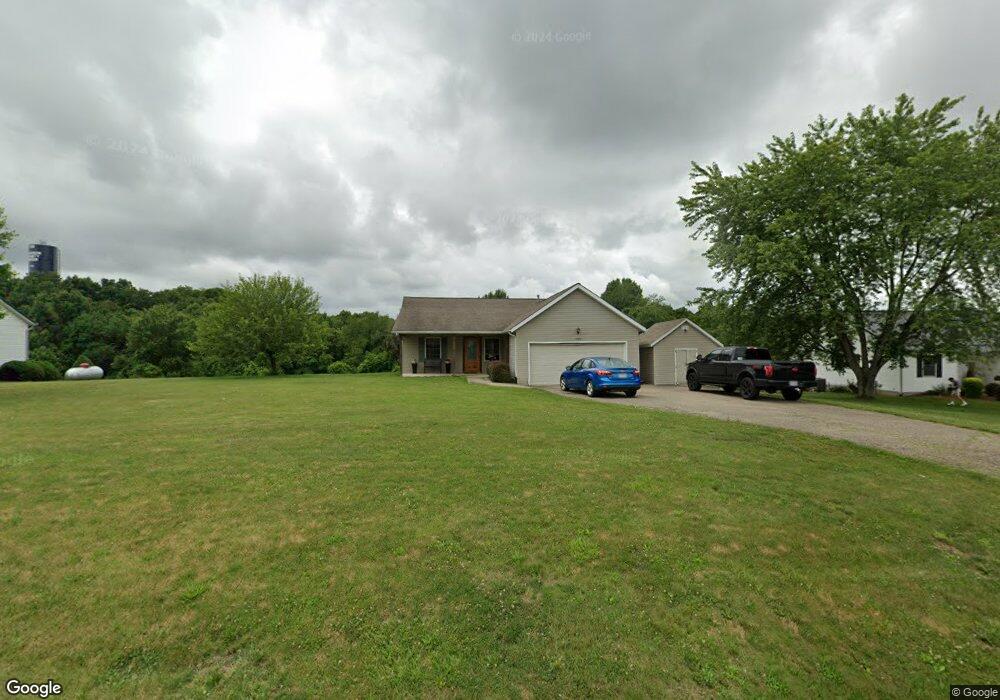
About This Home
This home is located at 1752 Standpipe Rd, Jackson, OH 45640 and is currently estimated at $260,836, approximately $206 per square foot. 1752 Standpipe Rd is a home located in Jackson County with nearby schools including Oak Hill Elementary School and Oak Hill Middle/High School.
Ownership History
We collect this data history from publicly available records. To have your information removed, we recommend requesting removal directly through your county’s website.
Purchase Details
Home Financials for this Owner
Home Financials are based on the most recent Mortgage that was taken out on this home.Purchase Details
Purchase Details
Purchase Details
Purchase Details
Purchase History
We collect this data history from publicly available records. To have your information removed, we recommend requesting removal directly through your county’s website.
| Date | Buyer | Sale Price | Title Company |
|---|---|---|---|
| $137,000 | Northwest Title | ||
| $105,000 | None Available | ||
| $90,000 | -- | ||
| $40,000 | -- | ||
| -- | -- |
Mortgage History
We collect this data history from publicly available records. To have your information removed, we recommend requesting removal directly through your county’s website.
| Date | Status | Borrower | Loan Amount |
|---|---|---|---|
| Open | $139,796 |
Tax History
We collect this data history from publicly available records. To have your information removed, we recommend requesting removal directly through your county’s website.
| Year | Tax Paid | Tax Assessment Tax Assessment Total Assessment is a certain percentage of the fair market value that is determined by local assessors to be the total taxable value of land and additions on the property. | Land | Improvement |
|---|---|---|---|---|
| 2025 | $1,633 | $50,890 | $6,980 | $43,910 |
| 2024 | $1,612 | $50,890 | $6,980 | $43,910 |
| 2023 | $1,612 | $50,890 | $6,980 | $43,910 |
| 2022 | $1,623 | $41,390 | $6,180 | $35,210 |
| 2021 | $1,399 | $41,390 | $6,180 | $35,210 |
| 2020 | $1,410 | $41,390 | $6,180 | $35,210 |
| 2019 | $1,267 | $35,980 | $5,370 | $30,610 |
| 2018 | $1,223 | $35,980 | $5,370 | $30,610 |
| 2017 | $1,115 | $35,980 | $5,370 | $30,610 |
| 2016 | $1,063 | $32,560 | $5,370 | $27,190 |
| 2015 | $1,076 | $32,560 | $5,370 | $27,190 |
| 2013 | $1,050 | $31,360 | $5,370 | $25,990 |
| 2012 | $1,069 | $31,360 | $5,370 | $25,990 |
Map
- 2102 Keystone Furnace Rd
- 857 Hanley Rd
- 2246 Cutlip Rd
- 600 Acy Ave
- 9993 Four Mile Rd
- 0 Cutlip St Unit (Tract 11 at Jackson
- 0 Cutlip St Unit (Tract 10 at Jackson
- 0 Industry Dr
- 10 Yellow Delicious Dr
- 1610 Erwin Rd
- 13 Pleasant View Dr
- 13 Pleasantview Dr
- 404 Ohio 327
- 119 Lewis St
- 434 Ohio 327
- 1951 Mayhew Rd
- 0 U S 35
- 103 Eastview Dr
- 281 Pattonsville Rd
- 2216 Russ Rd
- 1732 Standpipe Rd
- 1782 Standpipe Rd
- 1731 Standpipe Rd
- 1792 Standpipe Rd
- 1809 Standpipe Rd
- 1696 Standpipe Rd
- 1720 Standpipe Rd
- 1886 Standpipe Rd
- 1687 Standpipe Rd
- 1847 Standpipe Rd
- 1887 Standpipe Rd
- 1625 Standpipe Rd
- 1620 Standpipe Rd
- 1621 Standpipe Rd
- 265 Glendonshire Ln
- 265 Glendonshire Ln
- 1542 Standpipe Rd
- 1581 Standpipe Rd
- 1953 Standpipe Rd
- 1703 Standpipe Rd
Ask me questions while you tour the home.