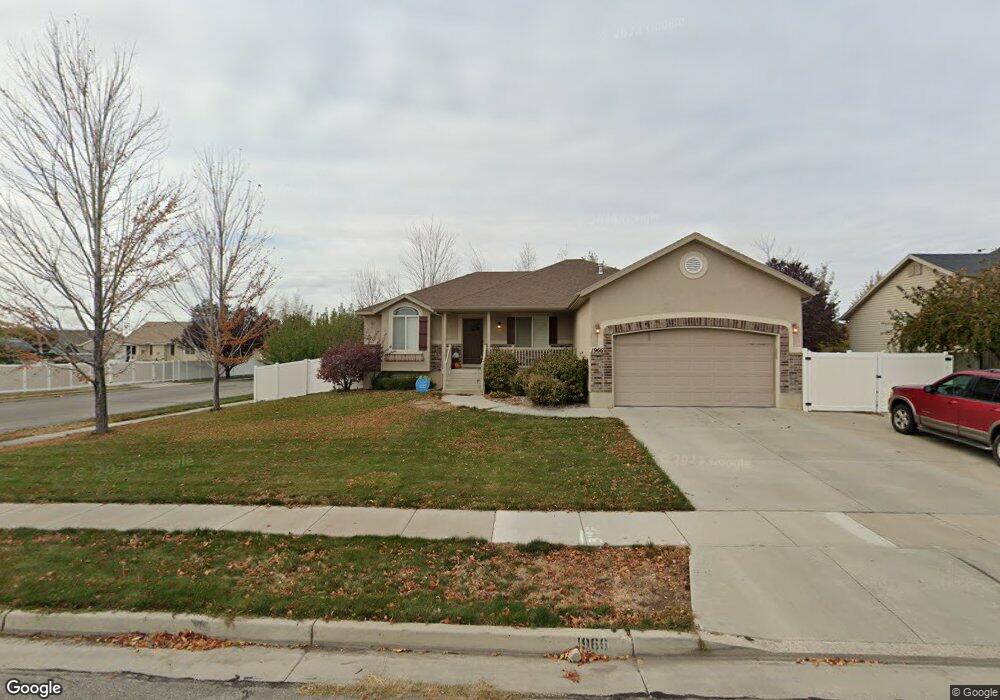
1752 W 1975 S Syracuse, UT 84075
Estimated Value: $556,000 - $594,000
5
Beds
3
Baths
1,558
Sq Ft
$368/Sq Ft
Est. Value
About This Home
This home is located at 1752 W 1975 S, Syracuse, UT 84075 and is currently estimated at $573,529, approximately $368 per square foot. 1752 W 1975 S is a home located in Davis County with nearby schools including Cook School, Syracuse Junior High School, and Syracuse High School.
Ownership History
Date
Name
Owned For
Owner Type
Purchase Details
Closed on
Aug 15, 2016
Sold by
Winfield Eugene L and Winfield Eugene Lee
Bought by
Williams Amelia A and Williams Keith J
Current Estimated Value
Purchase Details
Closed on
Dec 18, 2014
Sold by
Winfield Eugene Lee and Winfield Ambre Lea
Bought by
Winfield Amber L and Winfield Eugene L
Purchase Details
Closed on
Mar 22, 2006
Sold by
Barber Scott W and Barber Rebecca B
Bought by
Winfield Eugene Lee and Winfield Ambre Lea
Purchase Details
Closed on
Nov 15, 2004
Sold by
Mike Schultz Construction Inc
Bought by
Barber Scott W and Barber Rebecca B
Home Financials for this Owner
Home Financials are based on the most recent Mortgage that was taken out on this home.
Original Mortgage
$155,200
Interest Rate
5.7%
Mortgage Type
Purchase Money Mortgage
Purchase Details
Closed on
Jun 2, 2004
Sold by
Northstar Property Development Inc
Bought by
Nilson & Co Inc and Nilson Homes
Create a Home Valuation Report for This Property
The Home Valuation Report is an in-depth analysis detailing your home's value as well as a comparison with similar homes in the area
Home Values in the Area
Average Home Value in this Area
Purchase History
| Date | Buyer | Sale Price | Title Company |
|---|---|---|---|
| Williams Amelia A | -- | Stewart Title | |
| Winfield Amber L | -- | Founders Title Co | |
| Winfield Eugene Lee | -- | First American Title | |
| Barber Scott W | -- | Heritage West Title Ins Agen | |
| Nilson & Co Inc | -- | Security Title Company |
Source: Public Records
Mortgage History
| Date | Status | Borrower | Loan Amount |
|---|---|---|---|
| Previous Owner | Barber Scott W | $155,200 | |
| Closed | Barber Scott W | $38,800 |
Source: Public Records
Tax History Compared to Growth
Tax History
| Year | Tax Paid | Tax Assessment Tax Assessment Total Assessment is a certain percentage of the fair market value that is determined by local assessors to be the total taxable value of land and additions on the property. | Land | Improvement |
|---|---|---|---|---|
| 2025 | $3,050 | $294,250 | $117,521 | $176,729 |
| 2024 | $2,871 | $278,850 | $96,072 | $182,778 |
| 2023 | $2,769 | $490,000 | $133,929 | $356,071 |
| 2022 | $2,965 | $287,650 | $77,249 | $210,401 |
| 2021 | $2,650 | $398,000 | $114,029 | $283,971 |
| 2020 | $2,359 | $343,000 | $99,897 | $243,103 |
| 2019 | $2,292 | $329,000 | $96,954 | $232,046 |
| 2018 | $2,133 | $304,000 | $94,007 | $209,993 |
| 2016 | $1,889 | $141,186 | $36,108 | $105,078 |
| 2015 | $1,845 | $131,341 | $36,108 | $95,233 |
| 2014 | $1,742 | $126,377 | $36,108 | $90,269 |
| 2013 | -- | $110,149 | $32,571 | $77,578 |
Source: Public Records
Map
Nearby Homes