
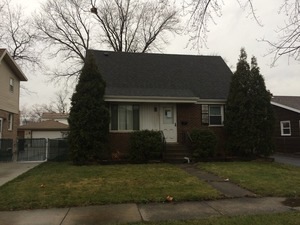
17524 Walter St Lansing, IL 60438
4
Beds
2
Baths
1,216
Sq Ft
6,098
Sq Ft Lot
About This Home
As of May 2021Lansing brick cape cod under construction for total rehab.
Last Agent to Sell the Property
Leverage Investments, LLC License #475163439 Listed on: 04/07/2016
Last Buyer's Agent
Non Member
NON MEMBER
Home Details
Home Type
- Single Family
Est. Annual Taxes
- $7,160
Year Built
- 1952
Parking
- Detached Garage
- Garage Is Owned
Home Design
- Brick Exterior Construction
- Vinyl Siding
Unfinished Basement
- Basement Fills Entire Space Under The House
Utilities
- Forced Air Heating and Cooling System
- Heating System Uses Gas
Ownership History
Date
Name
Owned For
Owner Type
Purchase Details
Listed on
Mar 12, 2021
Closed on
Apr 26, 2021
Sold by
Dunning Benjamin
Bought by
Jones Felicia L
Seller's Agent
Kashish Bhojwani
@properties Christie's International Real Estate
Buyer's Agent
Joanna Dlugopolski
Listing Leaders Northwest, Inc
List Price
$155,000
Sold Price
$165,000
Premium/Discount to List
$10,000
6.45%
Current Estimated Value
Home Financials for this Owner
Home Financials are based on the most recent Mortgage that was taken out on this home.
Estimated Appreciation
$34,076
Avg. Annual Appreciation
4.49%
Original Mortgage
$162,011
Interest Rate
3.37%
Mortgage Type
FHA
Purchase Details
Listed on
Sep 20, 2016
Closed on
Oct 3, 2016
Sold by
Mack Loc I Llc
Bought by
Dunning Benjamin
Seller's Agent
John Coakley
Vylla Home
Buyer's Agent
Telly Rayford
HomeSmart Realty Group
Sold Price
$1,549
Home Financials for this Owner
Home Financials are based on the most recent Mortgage that was taken out on this home.
Avg. Annual Appreciation
6.22%
Purchase Details
Listed on
Feb 17, 2016
Closed on
May 13, 2016
Sold by
Mack Industries Ii Llc
Bought by
Mack Loc I Llc
Seller's Agent
Mary Lynn Calgaro
Century 21 Circle
Buyer's Agent
Jose Flores
Leverage Investments, LLC
List Price
$55,000
Sold Price
$41,000
Premium/Discount to List
-$14,000
-25.45%
Home Financials for this Owner
Home Financials are based on the most recent Mortgage that was taken out on this home.
Avg. Annual Appreciation
658.98%
Purchase Details
Listed on
Feb 17, 2016
Closed on
Mar 11, 2016
Sold by
Optb 2015 Sfr Llc
Bought by
Mack Industries Ii Llc
Seller's Agent
Mary Lynn Calgaro
Century 21 Circle
Buyer's Agent
Jose Flores
Leverage Investments, LLC
List Price
$55,000
Sold Price
$41,000
Premium/Discount to List
-$14,000
-25.45%
Purchase Details
Closed on
Dec 10, 2015
Sold by
Stack Melissa
Bought by
Optb 2015 & Sfr Llc
Purchase Details
Closed on
Dec 12, 2006
Sold by
Ciszek Walter S
Bought by
Ciszek Walter S and The Walter S Ciszek Trust
Similar Homes in the area
Create a Home Valuation Report for This Property
The Home Valuation Report is an in-depth analysis detailing your home's value as well as a comparison with similar homes in the area
Home Values in the Area
Average Home Value in this Area
Purchase History
| Date | Type | Sale Price | Title Company |
|---|---|---|---|
| Warranty Deed | $165,000 | Citywide Title Corporation | |
| Warranty Deed | $125,000 | None Available | |
| Quit Claim Deed | -- | Greater Illinois Title | |
| Special Warranty Deed | $41,000 | Chicago Title | |
| Sheriffs Deed | -- | Attorney | |
| Interfamily Deed Transfer | -- | None Available |
Source: Public Records
Mortgage History
| Date | Status | Loan Amount | Loan Type |
|---|---|---|---|
| Open | $15,541 | FHA | |
| Closed | $22,177 | FHA | |
| Previous Owner | $162,011 | FHA | |
| Previous Owner | $41,000 | Unknown |
Source: Public Records
Property History
| Date | Event | Price | Change | Sq Ft Price |
|---|---|---|---|---|
| 05/11/2021 05/11/21 | Sold | $165,000 | +6.5% | $136 / Sq Ft |
| 03/25/2021 03/25/21 | Pending | -- | -- | -- |
| 03/23/2021 03/23/21 | For Sale | $155,000 | 0.0% | $127 / Sq Ft |
| 03/15/2021 03/15/21 | Pending | -- | -- | -- |
| 03/12/2021 03/12/21 | For Sale | $155,000 | 0.0% | $127 / Sq Ft |
| 11/07/2016 11/07/16 | Rented | $1,549 | 0.0% | -- |
| 10/16/2016 10/16/16 | Under Contract | -- | -- | -- |
| 10/12/2016 10/12/16 | For Rent | $1,549 | 0.0% | -- |
| 10/04/2016 10/04/16 | Sold | $125,000 | 0.0% | $103 / Sq Ft |
| 09/26/2016 09/26/16 | Under Contract | -- | -- | -- |
| 09/20/2016 09/20/16 | For Rent | $1,549 | 0.0% | -- |
| 07/01/2016 07/01/16 | Pending | -- | -- | -- |
| 04/07/2016 04/07/16 | For Sale | $138,000 | +236.6% | $113 / Sq Ft |
| 03/16/2016 03/16/16 | Sold | $41,000 | -25.5% | $34 / Sq Ft |
| 02/29/2016 02/29/16 | Pending | -- | -- | -- |
| 02/17/2016 02/17/16 | For Sale | $55,000 | -- | $45 / Sq Ft |
Source: Midwest Real Estate Data (MRED)
Tax History Compared to Growth
Tax History
| Year | Tax Paid | Tax Assessment Tax Assessment Total Assessment is a certain percentage of the fair market value that is determined by local assessors to be the total taxable value of land and additions on the property. | Land | Improvement |
|---|---|---|---|---|
| 2024 | $7,160 | $14,801 | $2,593 | $12,208 |
| 2023 | $5,971 | $14,801 | $2,593 | $12,208 |
| 2022 | $5,971 | $9,189 | $2,288 | $6,901 |
| 2021 | $5,808 | $9,188 | $2,287 | $6,901 |
| 2020 | $5,391 | $9,188 | $2,287 | $6,901 |
| 2019 | $4,809 | $8,446 | $2,135 | $6,311 |
| 2018 | $4,719 | $8,446 | $2,135 | $6,311 |
| 2017 | $4,765 | $8,446 | $2,135 | $6,311 |
| 2016 | $4,433 | $8,108 | $1,982 | $6,126 |
| 2015 | $4,119 | $8,108 | $1,982 | $6,126 |
| 2014 | $4,063 | $8,108 | $1,982 | $6,126 |
| 2013 | $4,276 | $9,496 | $1,982 | $7,514 |
Source: Public Records
Agents Affiliated with this Home
-
Seller's Agent in 2021
Kashish Bhojwani
@ Properties
(732) 589-9120
2 in this area
18 Total Sales
-
Buyer's Agent in 2021
Joanna Dlugopolski
Listing Leaders Northwest, Inc
(630) 788-0698
1 in this area
185 Total Sales
-
J
Seller's Agent in 2016
John Coakley
Vylla Home
(708) 778-1516
-
Seller's Agent in 2016
Jose Flores
Leverage Investments, LLC
(904) 718-7656
1 in this area
21 Total Sales
-
M
Seller's Agent in 2016
Mary Lynn Calgaro
Century 21 Circle
(312) 550-3423
2 in this area
4 Total Sales
-
Buyer's Agent in 2016
Telly Rayford
HomeSmart Realty Group
(708) 609-7209
9 in this area
121 Total Sales
Map
Source: Midwest Real Estate Data (MRED)
MLS Number: MRD09187860
APN: 30-29-307-044-0000
Disclaimer: Certain information contained herein is derived from information provided by parties other than Homes.com. All information provided is deemed reliable, but is not guaranteed to be accurate and should be independently verified.
![]() Based on information submitted to the MLS GRID. All data is obtained from various sources and may not have been verified by broker or MLS GRID. Supplied Open House Information is subject to change without notice. All information should be independently reviewed and verified for accuracy. Properties may or may not be listed by the office/agent presenting the information. Some IDX listings have been excluded from this website.
Based on information submitted to the MLS GRID. All data is obtained from various sources and may not have been verified by broker or MLS GRID. Supplied Open House Information is subject to change without notice. All information should be independently reviewed and verified for accuracy. Properties may or may not be listed by the office/agent presenting the information. Some IDX listings have been excluded from this website.
The Digital Millennium Copyright Act of 1998, 17 U.S.C. § 512 (the “DMCA”) provides recourse for copyright owners who believe that material appearing on the Internet infringes their rights under U.S. copyright law. If you believe in good faith that any content or material made available in connection with our website or services infringes your copyright, you (or your agent) may send us a notice requesting that the content or material be removed, or access to it blocked.
Notices must be sent in writing by email to DMCAnotice@MLSGrid.com.
The DMCA requires that your notice of alleged copyright infringement include the following information:
(1) description of the copyrighted work that is the subject of claimed infringement;
(2) description of the alleged infringing content and information sufficient to permit us to locate the content;
(3) contact information for you, including your address, telephone number and email address;
(4) a statement by you that you have a good faith belief that the content in the manner complained of is not authorized by the copyright owner, or its agent, or by the operation of any law;
(5) a statement by you, signed under penalty of perjury, that the information in the notification is accurate and that you have the authority to enforce the copyrights that are claimed to be infringed; and
(6) a physical or electronic signature of the copyright owner or a person authorized to act on the copyright owner’s behalf. Failure to include all of the above information may result in the delay of the processing of your complaint.
Nearby Homes
- 17415 Burnham Ave
- 17608 Community St
- 3119 176th St
- 17603 Community St
- 3127 Bernice Rd Unit 2
- 3127 Bernice Rd Unit 6
- 17332 Roy St
- 17715 Roy St
- 17331 Community St
- 17317 Roy St
- 17745 Burnham Ave
- 3425 Bernice Ave
- 17303 Roy St
- 3026 Bernice Rd Unit 308
- 17724 Henry St
- 3010 Bernice Rd Unit 303
- 3010 Bernice Rd Unit 104
- 17701 Park Blvd Unit 103
- 3313 178th St
- 17506 Bernadine St