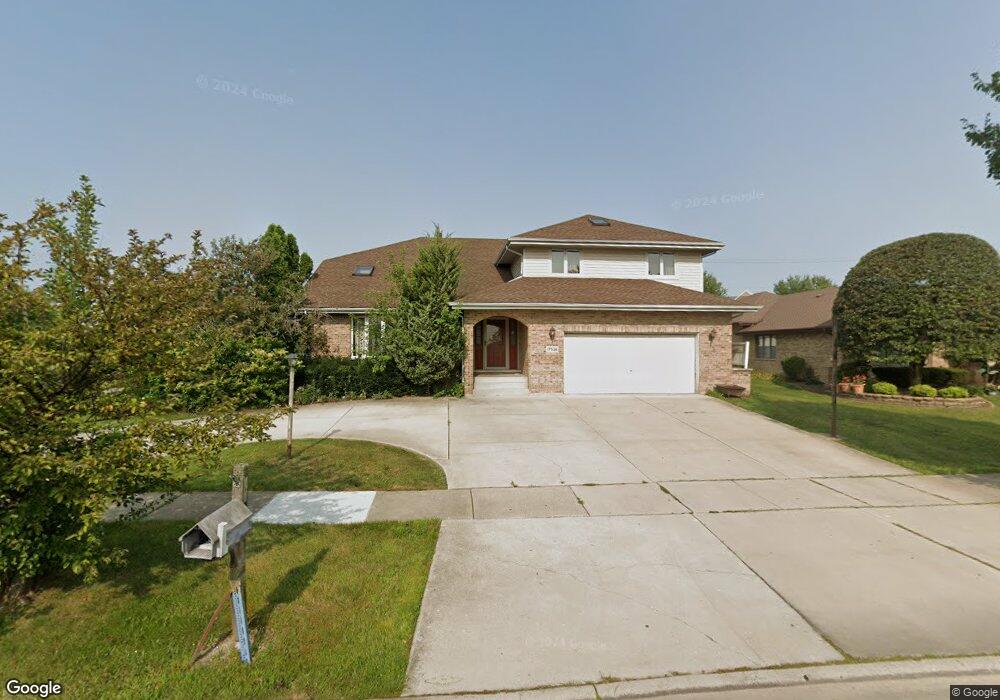
17526 Aster Ln Tinley Park, IL 60477
Central Tinley Park NeighborhoodEstimated Value: $521,000 - $535,000
4
Beds
3
Baths
3,250
Sq Ft
$162/Sq Ft
Est. Value
About This Home
This home is located at 17526 Aster Ln, Tinley Park, IL 60477 and is currently estimated at $525,647, approximately $161 per square foot. 17526 Aster Ln is a home located in Cook County with nearby schools including Millennium Elementary School, Prairie View Middle School, and Victor J Andrew High School.
Ownership History
Date
Name
Owned For
Owner Type
Purchase Details
Closed on
Jun 20, 2005
Sold by
Heffernan Matthew J and Heffernan Genevieve
Bought by
Sustaita Jose A and Sustaita Hilda
Current Estimated Value
Home Financials for this Owner
Home Financials are based on the most recent Mortgage that was taken out on this home.
Original Mortgage
$324,700
Outstanding Balance
$169,404
Interest Rate
5.75%
Mortgage Type
Fannie Mae Freddie Mac
Estimated Equity
$356,243
Create a Home Valuation Report for This Property
The Home Valuation Report is an in-depth analysis detailing your home's value as well as a comparison with similar homes in the area
Home Values in the Area
Average Home Value in this Area
Purchase History
| Date | Buyer | Sale Price | Title Company |
|---|---|---|---|
| Sustaita Jose A | $382,000 | Attorneys Title Guaranty Fun |
Source: Public Records
Mortgage History
| Date | Status | Borrower | Loan Amount |
|---|---|---|---|
| Open | Sustaita Jose A | $324,700 |
Source: Public Records
Tax History Compared to Growth
Tax History
| Year | Tax Paid | Tax Assessment Tax Assessment Total Assessment is a certain percentage of the fair market value that is determined by local assessors to be the total taxable value of land and additions on the property. | Land | Improvement |
|---|---|---|---|---|
| 2024 | $11,018 | $43,000 | $7,157 | $35,843 |
| 2023 | $11,133 | $43,000 | $7,157 | $35,843 |
| 2022 | $11,133 | $34,646 | $6,262 | $28,384 |
| 2021 | $10,805 | $34,646 | $6,262 | $28,384 |
| 2020 | $10,601 | $34,646 | $6,262 | $28,384 |
| 2019 | $10,717 | $36,475 | $5,665 | $30,810 |
| 2018 | $10,486 | $36,475 | $5,665 | $30,810 |
| 2017 | $10,225 | $36,475 | $5,665 | $30,810 |
| 2016 | $10,765 | $34,910 | $5,069 | $29,841 |
| 2015 | $10,609 | $34,910 | $5,069 | $29,841 |
| 2014 | $10,535 | $34,910 | $5,069 | $29,841 |
| 2013 | $8,795 | $31,752 | $5,069 | $26,683 |
Source: Public Records
Map
Nearby Homes
- 8530 Radcliffe Rd
- Eden Plan at Radcliffe Place
- Fremont Plan at Radcliffe Place
- Danbury Plan at Radcliffe Place
- Calysta Plan at Radcliffe Place
- Briarcliffe Plan at Radcliffe Place
- Amberwood Plan at Radcliffe Place
- 8543 Carriage Ln
- 17800 Iroquois Trace
- 17324 Humber Ln
- 17631 Dover Ct
- 17155 Kamp Ct Unit 9
- 17418 Avon Ln
- 7925 Belle Rive Ct
- 8444 W 171st St
- 17908 Iroquois Trace
- 8456 170th Place
- 8229 170th St Unit 8229
- 17105 Rochelle Ln
- 8800 172nd St