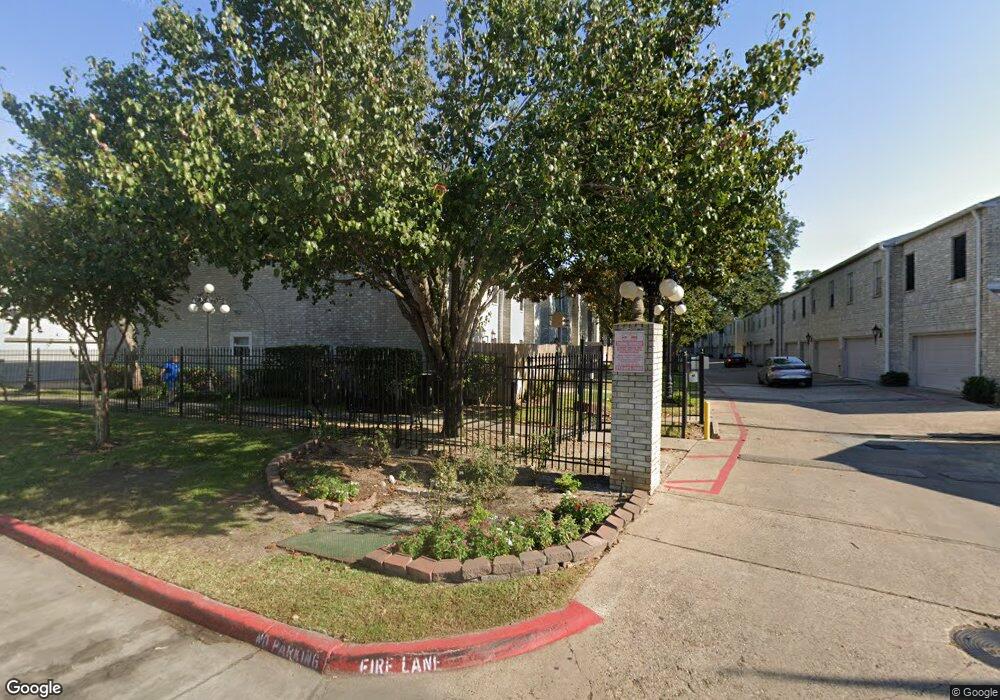
17527 Red Oak Dr Unit 7527 Houston, TX 77090
Champions NeighborhoodEstimated Value: $107,147 - $149,000
2
Beds
3
Baths
1,640
Sq Ft
$81/Sq Ft
Est. Value
About This Home
This home is located at 17527 Red Oak Dr Unit 7527, Houston, TX 77090 and is currently estimated at $132,787, approximately $80 per square foot. 17527 Red Oak Dr Unit 7527 is a home located in Harris County with nearby schools including Bammel Elementary School, Edwin M. Wells Middle School, and Westfield High School.
Ownership History
Date
Name
Owned For
Owner Type
Purchase Details
Closed on
Nov 16, 2015
Sold by
Hernandez Thomas and Hernandez Tina Marie
Bought by
Palumbo Frederick C and Palumbo Ginger Emory
Current Estimated Value
Purchase Details
Closed on
Jul 11, 2011
Sold by
Provience Tammy
Bought by
Hernandez Thomas and Hernandez Tina Marie
Purchase Details
Closed on
May 16, 2005
Sold by
Dubois Hope Anne
Bought by
Provience Tammy
Home Financials for this Owner
Home Financials are based on the most recent Mortgage that was taken out on this home.
Original Mortgage
$85,450
Interest Rate
5.92%
Mortgage Type
FHA
Purchase Details
Closed on
Aug 4, 2004
Sold by
Estate Of Marion Hope Rhodabarger
Bought by
Rhodabager Family Trust and Rhodabarger Marion Hope
Create a Home Valuation Report for This Property
The Home Valuation Report is an in-depth analysis detailing your home's value as well as a comparison with similar homes in the area
Home Values in the Area
Average Home Value in this Area
Purchase History
| Date | Buyer | Sale Price | Title Company |
|---|---|---|---|
| Palumbo Frederick C | -- | Patriot Title | |
| Hernandez Thomas | -- | American Title Company | |
| Provience Tammy | -- | American Title Co | |
| Rhodabager Family Trust | -- | -- |
Source: Public Records
Mortgage History
| Date | Status | Borrower | Loan Amount |
|---|---|---|---|
| Previous Owner | Provience Tammy | $85,450 |
Source: Public Records
Tax History Compared to Growth
Tax History
| Year | Tax Paid | Tax Assessment Tax Assessment Total Assessment is a certain percentage of the fair market value that is determined by local assessors to be the total taxable value of land and additions on the property. | Land | Improvement |
|---|---|---|---|---|
| 2025 | $2,885 | $137,537 | $26,132 | $111,405 |
| 2024 | $2,885 | $137,537 | $26,132 | $111,405 |
| 2023 | $2,885 | $134,408 | $25,538 | $108,870 |
| 2022 | $2,443 | $112,116 | $22,657 | $89,459 |
| 2021 | $2,427 | $105,200 | $19,988 | $85,212 |
| 2020 | $2,400 | $97,602 | $19,989 | $77,613 |
| 2019 | $2,471 | $96,556 | $18,346 | $78,210 |
| 2018 | $2,611 | $86,454 | $16,426 | $70,028 |
| 2017 | $2,181 | $86,454 | $16,426 | $70,028 |
| 2016 | $2,064 | $81,826 | $15,547 | $66,279 |
| 2015 | $1,681 | $64,888 | $12,329 | $52,559 |
| 2014 | $1,681 | $65,491 | $12,443 | $53,048 |
Source: Public Records
Map
Nearby Homes
- 17585 Red Oak Dr Unit 7585
- 17591 Red Oak Dr Unit 7591
- 17583 Red Oak Dr Unit 7583
- 17471 Red Oak Dr Unit 7471
- 17481 Red Oak Dr Unit 7481
- 17597 Red Oak Dr Unit 7597
- 17631 Red Oak Dr Unit 7631
- 17401 Red Oak Dr Unit 102
- 17331 Red Oak Dr Unit 22
- 17331 Red Oak Dr Unit 36
- 17331 Red Oak Dr Unit 26
- 17331 Red Oak Dr Unit 38
- 17331 Red Oak Dr Unit 14
- 17331 Red Oak Dr Unit 8
- 17331 Red Oak Dr Unit D 34
- 811 Loire Ln
- 1103 Suwanee Ln
- 1118 Marne Ln
- 1011 Baltic Ln
- 1114 Manatee Ln
- 17525 Red Oak Dr Unit 7525
- 17529 Red Oak Dr Unit 7529
- 17531 Red Oak Dr Unit 7531
- 17533 Red Oak Dr Unit 7533
- 17611 Red Oak Dr Unit 7611
- 17515 Red Oak Dr Unit 7515
- 17505 Red Oak Dr Unit 7505
- 17555 Red Oak Dr Unit 7555
- 17419 Red Oak Dr Unit 7419
- 17565 Red Oak Dr Unit 7565
- 17587 Red Oak Dr Unit 7587
- 17567 Red Oak Dr Unit 7567
- 17509 Red Oak Dr Unit 7509
- 17519 Red Oak Dr Unit 7519
- 17523 Red Oak Dr Unit 7523
- 17563 Red Oak Dr Unit 7563
- 17521 Red Oak Dr Unit 7521
- 17569 Red Oak Dr Unit 7569
- 17513 Red Oak Dr Unit 7513
- 17571 Red Oak Dr Unit 7571