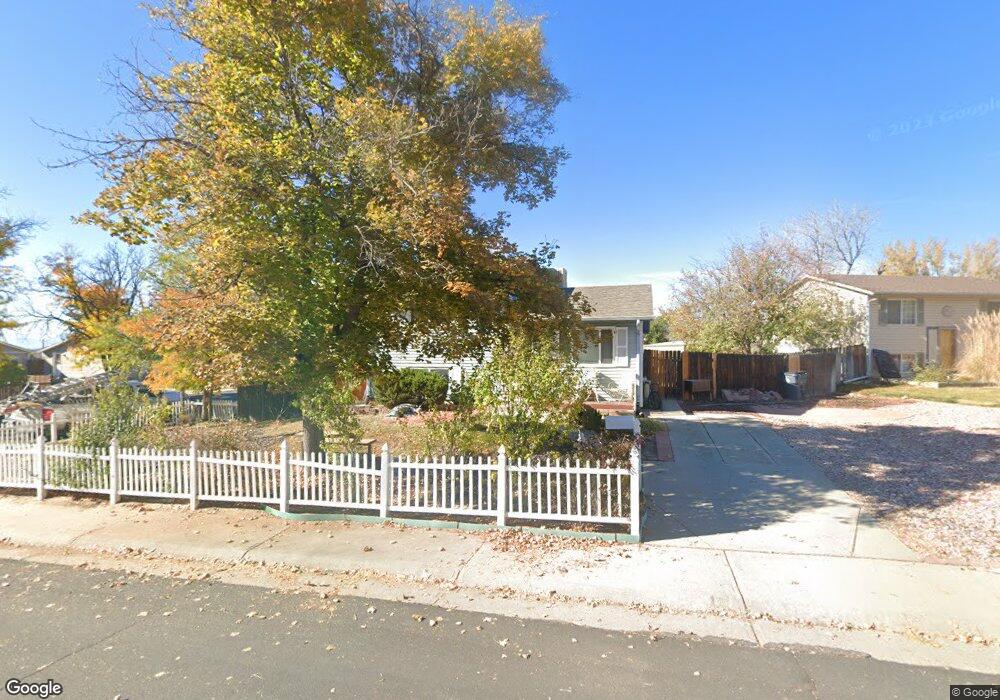
1753 Kalispell Ct Aurora, CO 80011
Norfolk Glen NeighborhoodEstimated Value: $327,000 - $381,000
3
Beds
1
Bath
1,095
Sq Ft
$325/Sq Ft
Est. Value
About This Home
This home is located at 1753 Kalispell Ct, Aurora, CO 80011 and is currently estimated at $355,871, approximately $324 per square foot. 1753 Kalispell Ct is a home located in Adams County with nearby schools including Altura Elementary School, Piute Middle School, and East Middle School.
Ownership History
Date
Name
Owned For
Owner Type
Purchase Details
Closed on
Mar 27, 2009
Sold by
Secretary Of Housing & Urban Development
Bought by
Hodge Rachel
Current Estimated Value
Purchase Details
Closed on
Aug 28, 2003
Sold by
Inman John C and Inman Cindy L
Bought by
Martinez Juana
Home Financials for this Owner
Home Financials are based on the most recent Mortgage that was taken out on this home.
Original Mortgage
$149,874
Interest Rate
6.31%
Mortgage Type
Unknown
Purchase Details
Closed on
Nov 30, 1994
Sold by
Thornberry Robert T and Manke Barbara A
Bought by
Inman John C and Inman Cindy L
Home Financials for this Owner
Home Financials are based on the most recent Mortgage that was taken out on this home.
Original Mortgage
$47,850
Interest Rate
8.8%
Create a Home Valuation Report for This Property
The Home Valuation Report is an in-depth analysis detailing your home's value as well as a comparison with similar homes in the area
Home Values in the Area
Average Home Value in this Area
Purchase History
| Date | Buyer | Sale Price | Title Company |
|---|---|---|---|
| Hodge Rachel | $80,150 | Wtg | |
| Martinez Juana | $152,000 | Guardian Title Agency | |
| Inman John C | $55,000 | Empire Title & Escrow | |
| Manke Barbara A | -- | -- |
Source: Public Records
Mortgage History
| Date | Status | Borrower | Loan Amount |
|---|---|---|---|
| Previous Owner | Martinez Juana | $149,874 | |
| Previous Owner | Inman John C | $47,850 |
Source: Public Records
Tax History Compared to Growth
Tax History
| Year | Tax Paid | Tax Assessment Tax Assessment Total Assessment is a certain percentage of the fair market value that is determined by local assessors to be the total taxable value of land and additions on the property. | Land | Improvement |
|---|---|---|---|---|
| 2024 | $2,177 | $20,250 | $5,060 | $15,190 |
| 2023 | $2,212 | $24,490 | $5,010 | $19,480 |
| 2022 | $2,007 | $17,660 | $5,140 | $12,520 |
| 2021 | $2,091 | $17,660 | $5,140 | $12,520 |
| 2020 | $2,167 | $18,360 | $5,290 | $13,070 |
| 2019 | $2,163 | $18,360 | $5,290 | $13,070 |
| 2018 | $1,599 | $13,520 | $3,890 | $9,630 |
| 2017 | $1,421 | $13,520 | $3,890 | $9,630 |
| 2016 | $1,061 | $10,010 | $2,630 | $7,380 |
| 2015 | $1,027 | $10,010 | $2,630 | $7,380 |
| 2014 | -- | $8,310 | $2,070 | $6,240 |
Source: Public Records
Map
Nearby Homes
- 16211 E 17th Place Unit C
- 16357 E 18th Place
- 16485 E 17th Place Unit D
- 15680 E Colfax Ave Unit F
- 15233 E 16th Dr
- 15195 E 16th Place Unit 104
- 15747 E 13th Place Unit B22
- 15775 E 13th Place
- 15737 E 13th Place
- 15771 E 13th Place Unit C34
- 15703 E 13th Place Unit 1A
- 1435 Norfolk St
- 1910 Altura Blvd
- 1960 Altura Blvd
- 1984 Buckley Way Unit 209
- 1541 Altura Blvd Unit 3
- 1686 Eisenhower Way Unit 170
- 1666 Eisenhower Way Unit 166
- 2281 Fairplay St
- 1977 Altura Blvd
- 1763 Kalispell Ct
- 1754 Kalispell Ct
- 1773 Kalispell Ct
- 1764 Kalispell Ct
- 15926 E 17th Place
- 15916 E 17th Place
- 1783 Kalispell Ct
- 15936 E 17th Place
- 1774 Kalispell Ct
- 15885 E 17th Place
- 15894 E 17th Place
- 15946 E 17th Place
- 15957 E 17th Place
- 15884 E 17th Place
- 1826 Kalispell St
- 1816 Kalispell St
- 15875 E 17th Place
- 15956 E 17th Place
- 15874 E 17th Place
- 15967 E 17th Place