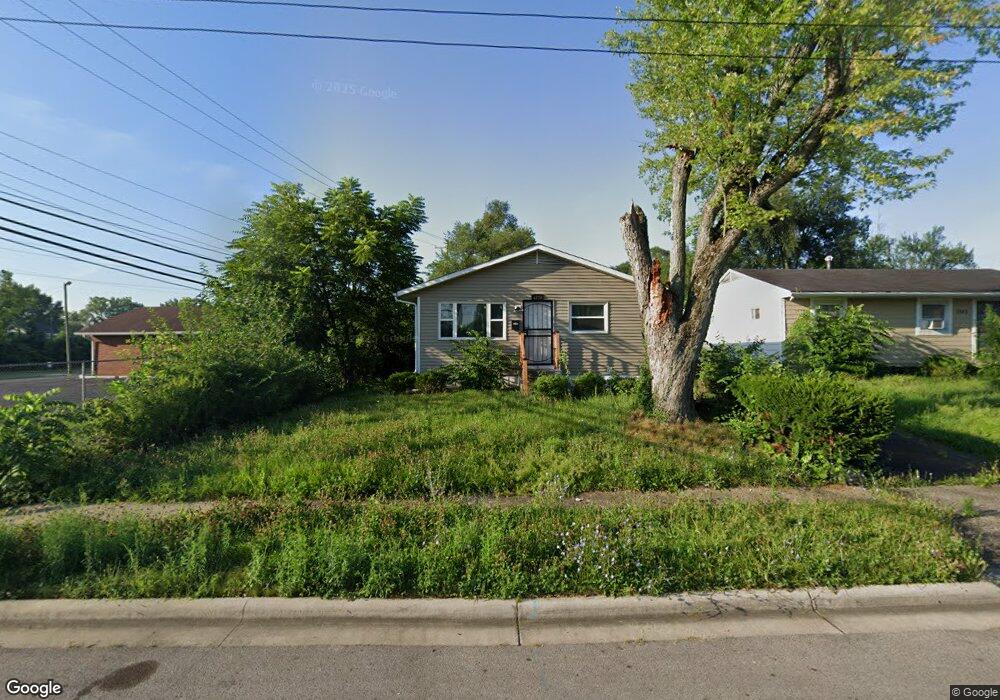
1753 Kenmore Rd Columbus, OH 43219
Argyle Park NeighborhoodEstimated Value: $125,000 - $146,000
3
Beds
1
Bath
925
Sq Ft
$147/Sq Ft
Est. Value
About This Home
This home is located at 1753 Kenmore Rd, Columbus, OH 43219 and is currently estimated at $135,664, approximately $146 per square foot. 1753 Kenmore Rd is a home located in Franklin County with nearby schools including Windsor Stem Acadmey, Linden-Mckinley Stem School On Arcadia, and North Columbus Preparatory Academy.
Ownership History
Date
Name
Owned For
Owner Type
Purchase Details
Closed on
Nov 12, 2018
Sold by
Cofer Birna
Bought by
Dream Komes E Lile Llc
Current Estimated Value
Purchase Details
Closed on
Feb 17, 2015
Sold by
Castle Alliance Llc
Bought by
Colfer Brian
Purchase Details
Closed on
Jul 28, 2009
Sold by
Federal Home Loan Mortgage Corporation
Bought by
Castle Alliance Llc
Purchase Details
Closed on
Apr 3, 2009
Sold by
White Herbert and White Bonnie L
Bought by
Federal Home Loan Mortgage Corp
Purchase Details
Closed on
May 28, 1996
Sold by
Turner Otho
Bought by
Herbert White
Home Financials for this Owner
Home Financials are based on the most recent Mortgage that was taken out on this home.
Original Mortgage
$50,350
Interest Rate
8.1%
Mortgage Type
FHA
Create a Home Valuation Report for This Property
The Home Valuation Report is an in-depth analysis detailing your home's value as well as a comparison with similar homes in the area
Home Values in the Area
Average Home Value in this Area
Purchase History
| Date | Buyer | Sale Price | Title Company |
|---|---|---|---|
| Dream Komes E Lile Llc | $39,500 | None Available | |
| Colfer Brian | $10,400 | None Available | |
| Castle Alliance Llc | $15,900 | Attorney | |
| Federal Home Loan Mortgage Corp | $24,000 | None Available | |
| Herbert White | $49,900 | -- |
Source: Public Records
Mortgage History
| Date | Status | Borrower | Loan Amount |
|---|---|---|---|
| Previous Owner | Herbert White | $50,350 |
Source: Public Records
Tax History Compared to Growth
Tax History
| Year | Tax Paid | Tax Assessment Tax Assessment Total Assessment is a certain percentage of the fair market value that is determined by local assessors to be the total taxable value of land and additions on the property. | Land | Improvement |
|---|---|---|---|---|
| 2024 | $6,230 | $36,300 | $4,450 | $31,850 |
| 2023 | $2,668 | $36,295 | $4,445 | $31,850 |
| 2022 | $5,495 | $16,560 | $2,980 | $13,580 |
| 2021 | $2,219 | $16,560 | $2,980 | $13,580 |
| 2020 | $1,894 | $16,560 | $2,980 | $13,580 |
| 2019 | $1,497 | $13,830 | $2,490 | $11,340 |
| 2018 | $1,180 | $13,830 | $2,490 | $11,340 |
| 2017 | $1,892 | $13,830 | $2,490 | $11,340 |
| 2016 | $1,544 | $11,450 | $2,450 | $9,000 |
| 2015 | $1,190 | $11,450 | $2,450 | $9,000 |
| 2014 | $710 | $11,450 | $2,450 | $9,000 |
| 2013 | $716 | $12,705 | $2,730 | $9,975 |
Source: Public Records
Map
Nearby Homes
- 1625 Kenmore Rd
- 1864 E Hudson St
- 1564-1566 E Blake Ave
- 1568 E Maynard Ave
- 1810 E 26th Ave
- 1799 Harold Place
- 2163 Cleveland Ave Unit 2161
- 2157 Cleveland Ave Unit 2153
- 1546 E 26th Ave
- 2126 Cleveland Ave
- 1527 E Hudson St
- 1519 E Hudson St
- 1975 Mock Rd
- 1614 Republic Ave
- 1457 Cordell Ave
- 2107 Cleveland Ave
- 0 Parkwood Ave
- 2444 Bancroft St
- 0 E Maynard Ave
- 1938 Myrtle Ave
- 1745 Kenmore Rd
- 1739 Kenmore Rd
- 1733 Kenmore Rd
- 1740 Cordell Ave
- 1736 Cordell Ave
- 1727 Kenmore Rd
- 1728 Cordell Ave
- 1724 Cordell Ave
- 1721 Kenmore Rd
- 1713 Kenmore Rd
- 1710 Cordell Ave
- 1737 Cordell Ave
- 1709 Kenmore Rd
- 0 Cordell Ave
- 1704 Cordell Ave
- 1725 Cordell Ave
- 1703 Kenmore Rd
- 1717 Cordell Ave
- 1698 Cordell Ave
- 1711 Cordell Ave