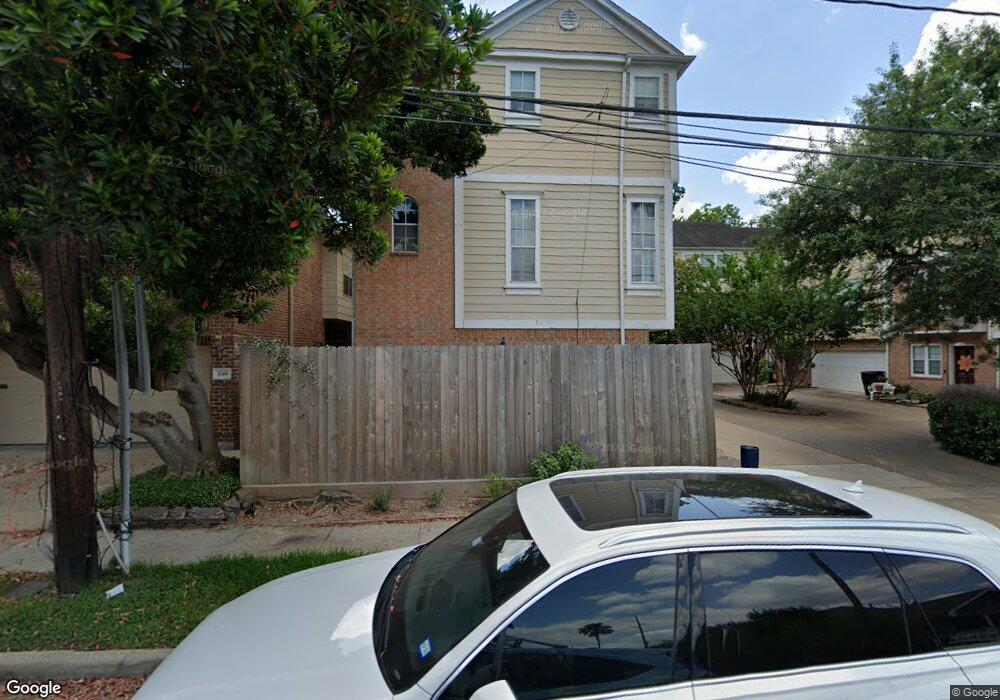
1753 Michigan St Unit B Houston, TX 77006
Montrose NeighborhoodEstimated Value: $409,204 - $525,000
2
Beds
3
Baths
1,611
Sq Ft
$284/Sq Ft
Est. Value
About This Home
This home is located at 1753 Michigan St Unit B, Houston, TX 77006 and is currently estimated at $457,301, approximately $283 per square foot. 1753 Michigan St Unit B is a home located in Harris County with nearby schools including Baker Montessori, Lanier Middle School, and Lamar High School.
Ownership History
Date
Name
Owned For
Owner Type
Purchase Details
Closed on
Dec 28, 2007
Sold by
Rosenthal Clint
Bought by
Sicinski Christopher
Current Estimated Value
Home Financials for this Owner
Home Financials are based on the most recent Mortgage that was taken out on this home.
Original Mortgage
$188,000
Outstanding Balance
$119,102
Interest Rate
6.23%
Mortgage Type
Purchase Money Mortgage
Estimated Equity
$338,199
Create a Home Valuation Report for This Property
The Home Valuation Report is an in-depth analysis detailing your home's value as well as a comparison with similar homes in the area
Home Values in the Area
Average Home Value in this Area
Purchase History
| Date | Buyer | Sale Price | Title Company |
|---|---|---|---|
| Sicinski Christopher | -- | Landamerica Partners Title C |
Source: Public Records
Mortgage History
| Date | Status | Borrower | Loan Amount |
|---|---|---|---|
| Open | Sicinski Christopher | $188,000 |
Source: Public Records
Tax History Compared to Growth
Tax History
| Year | Tax Paid | Tax Assessment Tax Assessment Total Assessment is a certain percentage of the fair market value that is determined by local assessors to be the total taxable value of land and additions on the property. | Land | Improvement |
|---|---|---|---|---|
| 2025 | $5,247 | $366,255 | $153,615 | $212,640 |
| 2024 | $5,247 | $364,683 | $145,530 | $219,153 |
| 2023 | $5,247 | $363,549 | $145,530 | $218,019 |
| 2022 | $6,724 | $305,377 | $145,530 | $159,847 |
| 2021 | $7,210 | $309,361 | $145,530 | $163,831 |
| 2020 | $8,686 | $358,698 | $145,530 | $213,168 |
| 2019 | $8,429 | $333,103 | $121,275 | $211,828 |
| 2018 | $6,666 | $342,500 | $126,126 | $216,374 |
| 2017 | $9,088 | $342,500 | $126,126 | $216,374 |
| 2016 | $8,850 | $333,526 | $126,126 | $207,400 |
| 2015 | $5,865 | $359,625 | $109,309 | $250,316 |
| 2014 | $5,865 | $313,700 | $84,084 | $229,616 |
Source: Public Records
Map
Nearby Homes
- 1728 Michigan St Unit A
- 1728 Michigan St Unit C
- 2025 Park St
- 1705 Michigan St
- 2314 Park St
- 1718 Welch St Unit C
- 2506 Mandell St Unit 3
- 2413 Ralph St Unit 2
- 1709 Haver St
- 2415 Elmen St
- 1621 Haver St
- 2011 Woodhead St
- 1808 Ridgewood St
- 1621 Cherryhurst St
- 1529 Welch St
- 1902 Elmen St
- 2003 Morse St
- 2026 Morse St
- 1519 1/2 Welch St
- 1506 Indiana St
- 1753 Michigan St Unit A
- 1753 Michigan St Unit C
- 1749 Michigan St
- 1757 Michigan St
- 1759 Michigan St
- 1755 Michigan St
- 1747 Michigan St
- 1750 Maryland St
- 1761 Michigan St Unit 4
- 1761 Michigan St
- 1761 Michigan St Unit 3
- 1761 Michigan St Unit 2
- 1743 Michigan St
- 1754 Maryland St
- 1746 Maryland St
- 1756 Maryland St
- 1739 Michigan St
- 1742 Maryland St
- 1832 Maryland St
- 1767 Michigan St