17533 Raymer St Unit A Northridge, CA 91325
Estimated Value: $1,456,000 - $1,568,000
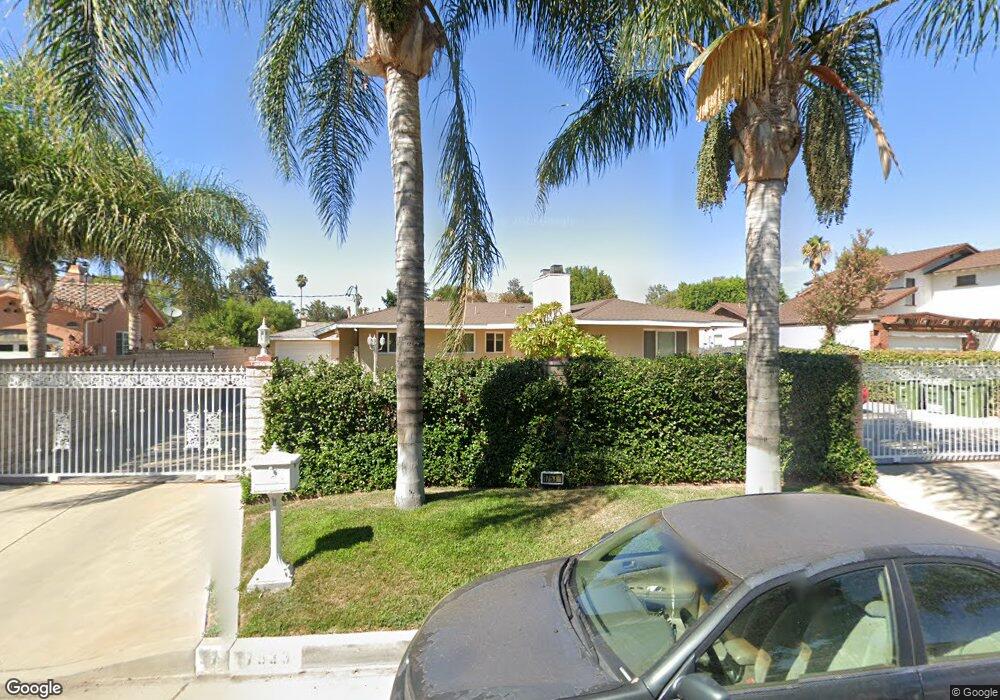
About This Home
This home is located at 17533 Raymer St Unit A, Northridge, CA 91325 and is currently estimated at $1,501,331, approximately $1,272 per square foot. 17533 Raymer St Unit A is a home located in Los Angeles County with nearby schools including Northridge Middle School, Northridge Academy High, and Valley Academy of Arts & Sciences.
Ownership History
We collect this data history from publicly available records. To have your information removed, we recommend requesting removal directly through your county’s website.
Purchase Details
Purchase Details
Home Financials for this Owner
Home Financials are based on the most recent Mortgage that was taken out on this home.Purchase Details
Home Financials for this Owner
Home Financials are based on the most recent Mortgage that was taken out on this home.Purchase Details
Home Financials for this Owner
Home Financials are based on the most recent Mortgage that was taken out on this home.Purchase Details
Home Financials for this Owner
Home Financials are based on the most recent Mortgage that was taken out on this home.Purchase Details
Home Financials for this Owner
Home Financials are based on the most recent Mortgage that was taken out on this home.Purchase Details
Purchase Details
Home Financials for this Owner
Home Financials are based on the most recent Mortgage that was taken out on this home.Purchase Details
Home Financials for this Owner
Home Financials are based on the most recent Mortgage that was taken out on this home.Purchase Details
Home Financials for this Owner
Home Financials are based on the most recent Mortgage that was taken out on this home.Purchase Details
Home Financials for this Owner
Home Financials are based on the most recent Mortgage that was taken out on this home.Purchase Details
Purchase Details
Purchase Details
Home Financials for this Owner
Home Financials are based on the most recent Mortgage that was taken out on this home.Home Values in the Area
Average Home Value in this Area
Purchase History
We collect this data history from publicly available records. To have your information removed, we recommend requesting removal directly through your county’s website.
| Date | Buyer | Sale Price | Title Company |
|---|---|---|---|
| -- | None Listed On Document | ||
| -- | Orange Coast Title Company | ||
| $1,350,000 | Orange Coast Title Company | ||
| -- | Ticor Title Company Of Ca | ||
| -- | Ticor | ||
| -- | Ticor | ||
| -- | Ticor Title Company Of Ca | ||
| -- | None Available | ||
| -- | None Available | ||
| -- | None Available | ||
| -- | None Available | ||
| -- | Progressive Title | ||
| $705,000 | Progressive Title | ||
| -- | None Available | ||
| -- | None Available | ||
| -- | None Available | ||
| -- | None Available | ||
| -- | -- | ||
| $340,000 | South Coast Title |
Mortgage History
We collect this data history from publicly available records. To have your information removed, we recommend requesting removal directly through your county’s website.
| Date | Status | Borrower | Loan Amount |
|---|---|---|---|
| Previous Owner | $1,149,000 | ||
| Previous Owner | $382,000 | ||
| Previous Owner | $385,000 | ||
| Previous Owner | $415,000 | ||
| Previous Owner | $255,000 |
Tax History
We collect this data history from publicly available records. To have your information removed, we recommend requesting removal directly through your county’s website.
| Year | Tax Paid | Tax Assessment Tax Assessment Total Assessment is a certain percentage of the fair market value that is determined by local assessors to be the total taxable value of land and additions on the property. | Land | Improvement |
|---|---|---|---|---|
| 2025 | $16,962 | $1,377,000 | $1,096,602 | $280,398 |
| 2024 | $10,501 | $830,685 | $492,638 | $338,047 |
| 2023 | $10,303 | $814,398 | $482,979 | $331,419 |
| 2022 | $9,837 | $798,430 | $473,509 | $324,921 |
| 2021 | $9,712 | $782,775 | $464,225 | $318,550 |
| 2020 | $9,805 | $774,749 | $459,465 | $315,284 |
| 2019 | $9,428 | $759,558 | $450,456 | $309,102 |
| 2018 | $9,115 | $744,666 | $441,624 | $303,042 |
| 2016 | $8,701 | $715,751 | $424,476 | $291,275 |
| 2015 | $8,658 | $705,000 | $418,100 | $286,900 |
| 2014 | $6,161 | $483,296 | $286,987 | $196,309 |
Map
- 8602 Shoshone Ave
- 17401 Raymer St
- 17545 Community St
- 8400 White Oak Ave
- 17441 Rayen St
- 17904 Acre St
- 17216 Parthenia St
- 8226 White Oak Ave
- 8523 & 8521 Lindley Ave
- 17211 Parthenia St
- 8225 Encino Ave
- 8207 White Oak Ave
- 8207 Yarmouth Ave
- 8836 Enfield Ave
- 17920 Schoenborn St
- 17926 Schoenborn St
- 17241 Roscoe Blvd Unit 16
- 8139 Jellico Ave
- 17945 Roscoe Blvd
- 17300 Sunburst St
- 17527 Raymer St
- 17555 Raymer St
- 17555 Raymer Raymer St
- 17524 Napa St
- 17519 Raymer St
- 17530 Napa St
- 17520 Napa St
- 17556 Napa St
- 17558 Napa St
- 8618 Shoshone Ave
- 8611 Encino Ave
- 8635 Encino Ave
- 17532 Raymer St
- 8601 Shoshone Ave
- 17522 Raymer St
- 17544 Raymer St
- 17556 Napa St
- 17566 Raymer St
- 17535 Napa St
- 8617 Shoshone Ave
Ask me questions while you tour the home.