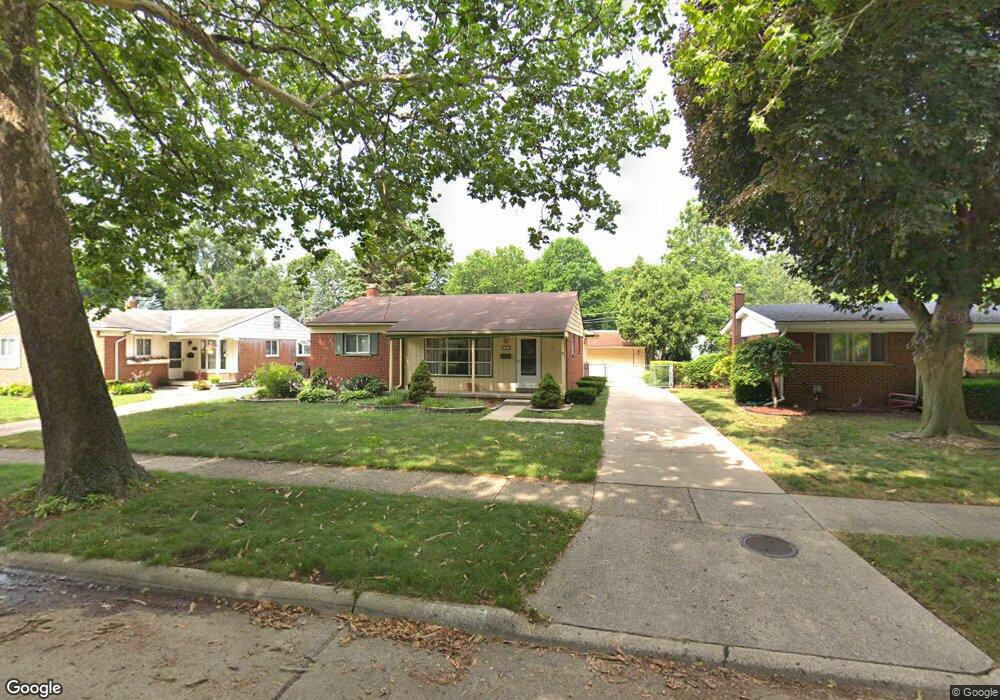
17535 Rougeway St Unit Bldg-Unit Livonia, MI 48152
Estimated Value: $281,000 - $311,341
3
Beds
3
Baths
1,314
Sq Ft
$227/Sq Ft
Est. Value
About This Home
This home is located at 17535 Rougeway St Unit Bldg-Unit, Livonia, MI 48152 and is currently estimated at $298,835, approximately $227 per square foot. 17535 Rougeway St Unit Bldg-Unit is a home located in Wayne County with nearby schools including Riley Upper Elementary School, Coolidge Elementary School, and Webster Elementary School.
Ownership History
Date
Name
Owned For
Owner Type
Purchase Details
Closed on
Feb 26, 2018
Sold by
Isamail Ali and Isamail Amal
Bought by
Malus Joseph
Current Estimated Value
Purchase Details
Closed on
Nov 6, 2017
Sold by
Weldon Jessica E
Bought by
Zagata Sheryl A
Home Financials for this Owner
Home Financials are based on the most recent Mortgage that was taken out on this home.
Original Mortgage
$160,107
Interest Rate
3.83%
Mortgage Type
New Conventional
Purchase Details
Closed on
Mar 16, 2012
Sold by
Ismail Ali and Ismail Amal
Bought by
Ismail Ali and Ismail Amal
Purchase Details
Closed on
Dec 16, 2002
Sold by
Klingensmith Steven M and Klingensmith Sandra M
Bought by
Ismail Ali
Purchase Details
Closed on
Dec 10, 2002
Sold by
Klingensmith Steven M and Klingensmith Sandra M
Bought by
Klingensmith Steven M
Create a Home Valuation Report for This Property
The Home Valuation Report is an in-depth analysis detailing your home's value as well as a comparison with similar homes in the area
Home Values in the Area
Average Home Value in this Area
Purchase History
| Date | Buyer | Sale Price | Title Company |
|---|---|---|---|
| Malus Joseph | $169,000 | Vintage Title Agency | |
| Zagata Sheryl A | -- | None Available | |
| Ismail Ali | -- | None Available | |
| Ismail Ali | $173,500 | First Michigan Title Inc | |
| Klingensmith Steven M | -- | First Michigan Title Inc |
Source: Public Records
Mortgage History
| Date | Status | Borrower | Loan Amount |
|---|---|---|---|
| Previous Owner | Zagata Sheryl A | $160,107 |
Source: Public Records
Tax History Compared to Growth
Tax History
| Year | Tax Paid | Tax Assessment Tax Assessment Total Assessment is a certain percentage of the fair market value that is determined by local assessors to be the total taxable value of land and additions on the property. | Land | Improvement |
|---|---|---|---|---|
| 2025 | $2,194 | $139,900 | $0 | $0 |
| 2024 | $2,194 | $128,400 | $0 | $0 |
| 2023 | $2,093 | $119,100 | $0 | $0 |
| 2022 | $3,675 | $107,300 | $0 | $0 |
| 2021 | $3,570 | $99,700 | $0 | $0 |
| 2019 | $3,273 | $80,600 | $0 | $0 |
| 2018 | $1,323 | $72,500 | $0 | $0 |
| 2017 | $3,426 | $70,300 | $0 | $0 |
| 2016 | $3,278 | $64,900 | $0 | $0 |
| 2015 | $5,523 | $61,610 | $0 | $0 |
| 2012 | -- | $58,200 | $15,900 | $42,300 |
Source: Public Records
Map
Nearby Homes
- 18001 Floral St
- 18071 Floral St
- 18061 Lathers St
- 18206 Foch St
- 18404 Deering St
- 18411 Foch St
- 18429 Gillman St
- 27030 W 6 Mile Rd
- 18496 Brentwood St
- 17612 Denby
- 18463 Poinciana
- 18626 Inkster Rd
- 18884 Lathers St
- 26610 W 6 Mile Rd
- 18646 Indian
- 29464 Bobrich St Unit 49
- 18851 Poinciana
- 18268 Delaware Ave
- 27416 Sunnydale St
- 19169 Inkster Rd
- 17535 Rougeway St
- 17523 Rougeway St
- 17547 Rougeway St
- 17511 Rougeway St
- 17559 Rougeway St
- 17550 Deering St
- 17536 Deering St
- 17568 Deering St
- 17514 Deering St
- 17363 Rougeway St
- 17586 Deering St
- 17715 Rougeway St
- 17540 Rougeway St
- 17528 Rougeway St
- 17552 Rougeway St
- 17516 Rougeway St
- 17398 Deering St
- 17712 Rougeway St
- 17351 Rougeway St
- 17727 Rougeway St