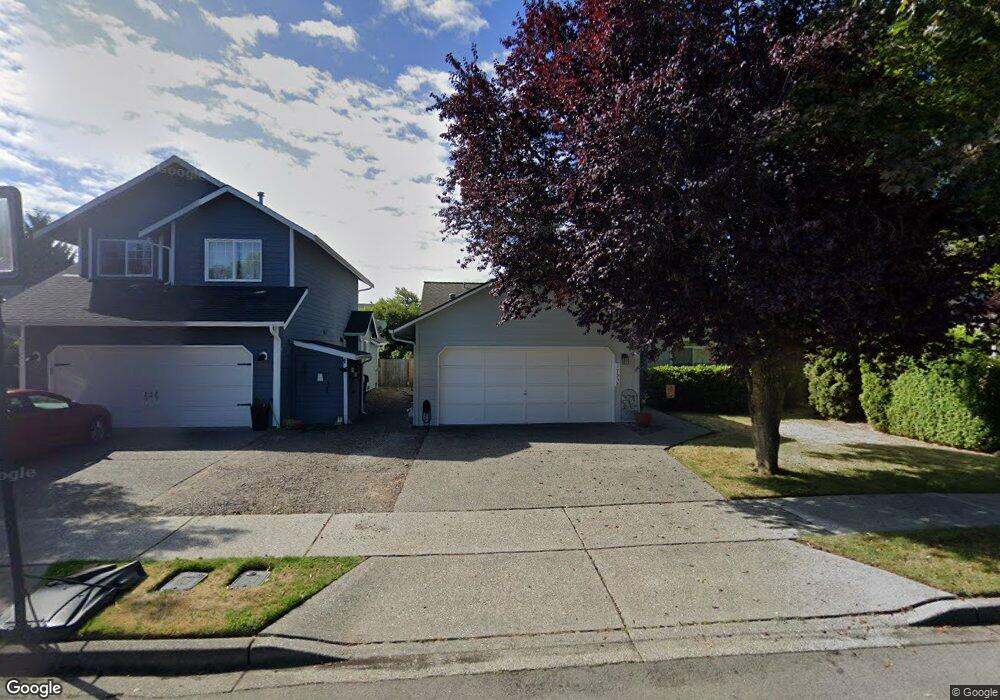
17538 Stanton St SE Monroe, WA 98272
Estimated Value: $586,000 - $622,000
3
Beds
2
Baths
1,280
Sq Ft
$471/Sq Ft
Est. Value
About This Home
This home is located at 17538 Stanton St SE, Monroe, WA 98272 and is currently estimated at $602,467, approximately $470 per square foot. 17538 Stanton St SE is a home located in Snohomish County with nearby schools including Frank Wagner Elementary School, Monroe High School, and Monroe Christian School.
Ownership History
Date
Name
Owned For
Owner Type
Purchase Details
Closed on
Jan 1, 2014
Sold by
Peterson Devereaux S and Peterson Carol G
Bought by
17538 Llc
Current Estimated Value
Purchase Details
Closed on
Sep 1, 2000
Sold by
Bailey Kevin A and Bailey Renee M
Bought by
Peterson Devereaux S and Peterson Carol G
Home Financials for this Owner
Home Financials are based on the most recent Mortgage that was taken out on this home.
Original Mortgage
$116,900
Interest Rate
8.11%
Purchase Details
Closed on
Jun 26, 1997
Sold by
Heritage Residential Corp
Bought by
Bailey Kevin A and Bailey Renee M
Home Financials for this Owner
Home Financials are based on the most recent Mortgage that was taken out on this home.
Original Mortgage
$120,961
Interest Rate
7.91%
Mortgage Type
FHA
Create a Home Valuation Report for This Property
The Home Valuation Report is an in-depth analysis detailing your home's value as well as a comparison with similar homes in the area
Home Values in the Area
Average Home Value in this Area
Purchase History
| Date | Buyer | Sale Price | Title Company |
|---|---|---|---|
| 17538 Llc | -- | Accommodation | |
| Peterson Devereaux S | $167,000 | -- | |
| Bailey Kevin A | $133,950 | -- |
Source: Public Records
Mortgage History
| Date | Status | Borrower | Loan Amount |
|---|---|---|---|
| Previous Owner | Peterson Devereaux S | $116,900 | |
| Previous Owner | Bailey Kevin A | $120,961 |
Source: Public Records
Tax History Compared to Growth
Tax History
| Year | Tax Paid | Tax Assessment Tax Assessment Total Assessment is a certain percentage of the fair market value that is determined by local assessors to be the total taxable value of land and additions on the property. | Land | Improvement |
|---|---|---|---|---|
| 2025 | $4,134 | $528,100 | $304,000 | $224,100 |
| 2024 | $4,134 | $510,500 | $289,000 | $221,500 |
| 2023 | $4,092 | $548,200 | $319,000 | $229,200 |
| 2022 | $3,694 | $394,800 | $213,000 | $181,800 |
| 2020 | $3,384 | $348,500 | $188,000 | $160,500 |
| 2019 | $3,235 | $328,900 | $178,000 | $150,900 |
| 2018 | $3,464 | $288,700 | $148,000 | $140,700 |
| 2017 | $2,954 | $257,500 | $125,000 | $132,500 |
| 2016 | $2,990 | $239,900 | $103,000 | $136,900 |
| 2015 | $2,811 | $212,200 | $89,000 | $123,200 |
| 2013 | $2,308 | $159,300 | $73,000 | $86,300 |
Source: Public Records
Map
Nearby Homes
- 17856 152nd St SE
- 15027 179th Ave SE
- 15217 172nd Ave SE
- 17795 149th St SE Unit 9
- 17815 149th St SE Unit 14
- 17803 149th St SE Unit 11
- 15087 172nd Ave SE
- 17284 157th St SE
- 17342 Mountain View Rd SE
- 15121 182nd Ave SE
- 15327 182nd Ave SE
- 18155 W Columbia St
- 16855 Wales St SE
- 18621 Blueberry Ln Unit A204
- 18510 Blueberry Ln
- 15111 167th Ave SE
- 1152 Johnson St SE
- 17417 W Main St Unit E101
- 16625 Ladd St SE
- 700 W Maple St
- 17520 Stanton St SE
- 17556 Stanton St SE
- 17580 Stanton St SE
- 15215 175th Ave SE
- 17598 Stanton St SE
- 17539 Stanton St SE
- 17521 Stanton St SE
- 17563 Stanton St SE
- 17490 Stanton St SE
- 15209 175th Ave SE
- 17581 Stanton St SE
- 15198 175th Ave SE
- 17622 Stanton St SE
- 15211 175th Ave SE
- 15192 175th Ave SE
- 17599 Stanton St SE
- 15256 176th Dr SE
- 17544 152nd St SE
- 17640 Stanton St SE
- 17526 152nd St SE