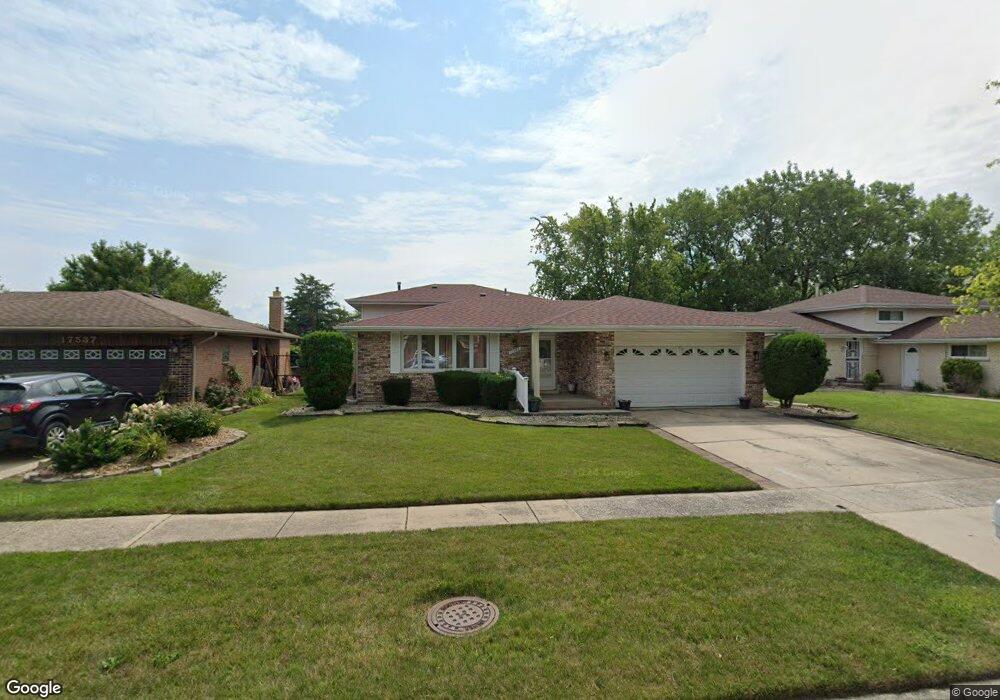
17543 Cypress Ave Country Club Hills, IL 60478
Estimated Value: $247,000 - $264,000
3
Beds
2
Baths
1,470
Sq Ft
$172/Sq Ft
Est. Value
About This Home
This home is located at 17543 Cypress Ave, Country Club Hills, IL 60478 and is currently estimated at $253,382, approximately $172 per square foot. 17543 Cypress Ave is a home located in Cook County with nearby schools including Zenon J Sykuta School, Meadowview Intermediate School, and Southwood Middle School.
Ownership History
Date
Name
Owned For
Owner Type
Purchase Details
Closed on
Feb 26, 2021
Sold by
Parker Betty and Parker Diane
Bought by
Parker Betty J and Parker Layetunde
Current Estimated Value
Home Financials for this Owner
Home Financials are based on the most recent Mortgage that was taken out on this home.
Original Mortgage
$61,000
Outstanding Balance
$54,838
Interest Rate
2.87%
Mortgage Type
New Conventional
Estimated Equity
$198,544
Purchase Details
Closed on
Jun 26, 2009
Sold by
Parker Betty
Bought by
Parker Betty and Turner Diane
Purchase Details
Closed on
Jul 28, 2006
Sold by
Parker Thad
Bought by
Parker Betty and Parker Thad
Purchase Details
Closed on
May 15, 2006
Sold by
Parker Betty
Bought by
Parker Thad
Purchase Details
Closed on
Jun 30, 1996
Sold by
American National Bk & Tr Co Of Chicago
Bought by
Parker Thad and Parker Betty
Create a Home Valuation Report for This Property
The Home Valuation Report is an in-depth analysis detailing your home's value as well as a comparison with similar homes in the area
Home Values in the Area
Average Home Value in this Area
Purchase History
| Date | Buyer | Sale Price | Title Company |
|---|---|---|---|
| Parker Betty J | -- | Carrington Ttl Partners Llc | |
| Parker Betty | -- | None Available | |
| Parker Betty | -- | None Available | |
| Parker Thad | -- | None Available | |
| Parker Thad | -- | -- |
Source: Public Records
Mortgage History
| Date | Status | Borrower | Loan Amount |
|---|---|---|---|
| Open | Parker Betty J | $61,000 |
Source: Public Records
Tax History Compared to Growth
Tax History
| Year | Tax Paid | Tax Assessment Tax Assessment Total Assessment is a certain percentage of the fair market value that is determined by local assessors to be the total taxable value of land and additions on the property. | Land | Improvement |
|---|---|---|---|---|
| 2024 | $633 | $20,001 | $3,188 | $16,813 |
| 2023 | $923 | $20,001 | $3,188 | $16,813 |
| 2022 | $923 | $13,254 | $2,813 | $10,441 |
| 2021 | $905 | $13,253 | $2,812 | $10,441 |
| 2020 | $857 | $13,253 | $2,812 | $10,441 |
| 2019 | $970 | $12,287 | $2,625 | $9,662 |
| 2018 | $929 | $12,287 | $2,625 | $9,662 |
| 2017 | $4,304 | $12,287 | $2,625 | $9,662 |
| 2016 | $2,376 | $11,951 | $2,250 | $9,701 |
| 2015 | $2,427 | $11,951 | $2,250 | $9,701 |
| 2014 | $2,335 | $11,951 | $2,250 | $9,701 |
| 2013 | $2,157 | $13,453 | $2,250 | $11,203 |
Source: Public Records
Map
Nearby Homes
- 4101 176th Place
- 4200 W 176th Place
- 4061 177th St
- 17700 Oakwood Ave
- 4207 176th Place
- 4101 Park Ln Unit 1
- 4240 176th St
- 17700 Springfield Ave
- 17511 Winston Dr Unit 1
- 3740 Highland Place
- 7R3 Country Club Ln
- 7R2 Country Club Ln
- 17963 Huntleigh Ct Unit 302
- 4411 177th Place
- 17963 Amherst Ct Unit 102
- 3861 178th Place
- 17942 Edwards Ave
- 17975 Huntleigh Ct Unit 301
- 17975 Amherst Ct Unit 301
- 3651 177th St
- 17549 Cypress Ave
- 17537 Cypress Ave
- 17555 Cypress Ave
- 17531 Cypress Ave
- 17601 Cypress Ave
- 17525 Cypress Ave
- 17542 Cypress Ave
- 17554 Cypress Ave
- 17554 Cypress Ave
- 17554 Cypress Ave
- 17536 Cypress Ave
- 17600 Cypress Ave
- 17607 Cypress Ave
- 17519 Cypress Ave
- 17530 Cypress Ave
- 17606 Cypress Ave
- 17613 Cypress Ave
- 17524 Cypress Ave
- 17513 Cypress Ave
- 17547 Chestnut Ave