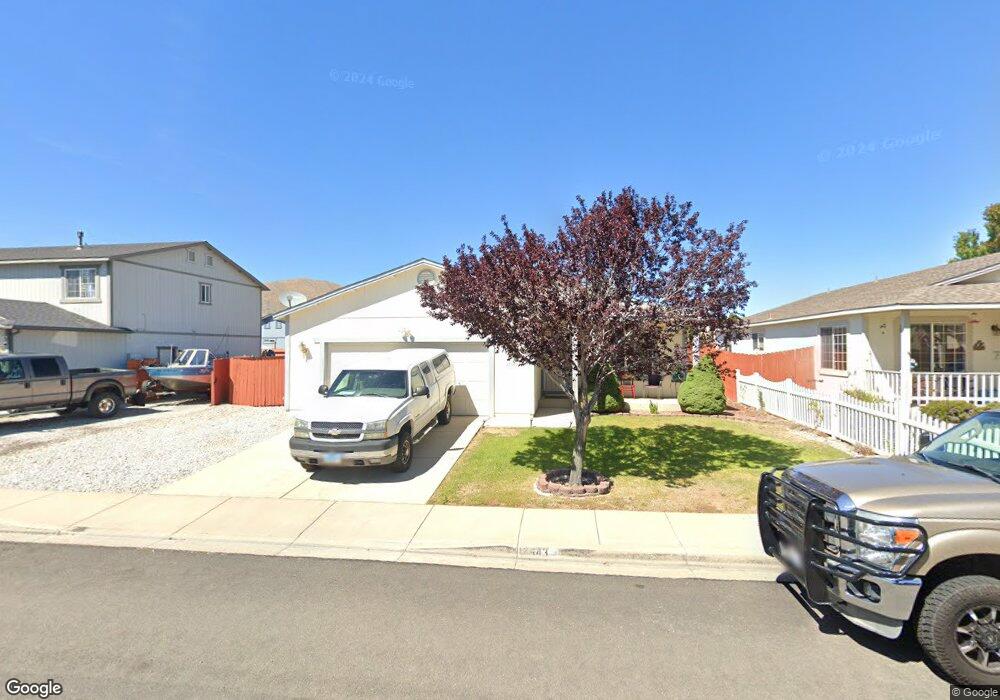
17543 Javalina Ct Reno, NV 89508
Cold Springs NeighborhoodEstimated Value: $415,762 - $439,000
4
Beds
2
Baths
1,568
Sq Ft
$271/Sq Ft
Est. Value
About This Home
This home is located at 17543 Javalina Ct, Reno, NV 89508 and is currently estimated at $425,441, approximately $271 per square foot. 17543 Javalina Ct is a home located in Washoe County with nearby schools including Cold Springs Middle School and North Valleys High School.
Ownership History
Date
Name
Owned For
Owner Type
Purchase Details
Closed on
Jun 20, 2025
Sold by
Long Donald and Long Ann
Bought by
Dr Pepper Living Trust and Long
Current Estimated Value
Purchase Details
Closed on
May 23, 2012
Sold by
Castleberry Margie
Bought by
Long Donald and Long Ann
Purchase Details
Closed on
Dec 9, 2011
Sold by
Fannie Mae
Bought by
Castleberry Margie L
Purchase Details
Closed on
Sep 20, 2011
Sold by
Sarratt Edward S and Sarratt Maria D
Bought by
Federal National Mortgage Association
Purchase Details
Closed on
Nov 17, 2008
Sold by
Sarratt Edward Scott
Bought by
Sarratt Maria
Purchase Details
Closed on
Jul 27, 2000
Sold by
Cold Springs 2000 Inc
Bought by
Sarratt Edward S and Sarratt Maria D
Home Financials for this Owner
Home Financials are based on the most recent Mortgage that was taken out on this home.
Original Mortgage
$126,340
Interest Rate
8.2%
Mortgage Type
FHA
Create a Home Valuation Report for This Property
The Home Valuation Report is an in-depth analysis detailing your home's value as well as a comparison with similar homes in the area
Home Values in the Area
Average Home Value in this Area
Purchase History
| Date | Buyer | Sale Price | Title Company |
|---|---|---|---|
| Dr Pepper Living Trust | -- | None Listed On Document | |
| Long Donald | $100,000 | None Available | |
| Castleberry Margie L | $100,000 | Stewart Title Of Nevada Reno | |
| Federal National Mortgage Association | $130,513 | Stewart Title Of Nevada Reno | |
| Sarratt Maria | -- | None Available | |
| Sarratt Maria | -- | None Available | |
| Sarratt Edward S | $128,500 | First American Title |
Source: Public Records
Mortgage History
| Date | Status | Borrower | Loan Amount |
|---|---|---|---|
| Previous Owner | Sarratt Edward S | $126,340 |
Source: Public Records
Tax History
| Year | Tax Paid | Tax Assessment Tax Assessment Total Assessment is a certain percentage of the fair market value that is determined by local assessors to be the total taxable value of land and additions on the property. | Land | Improvement |
|---|---|---|---|---|
| 2026 | $1,067 | $91,196 | $32,620 | $58,576 |
| 2025 | $1,383 | $93,009 | $33,320 | $59,689 |
| 2024 | $1,383 | $87,123 | $27,020 | $60,103 |
| 2023 | $1,343 | $84,331 | $31,080 | $53,251 |
| 2022 | $1,304 | $70,564 | $26,250 | $44,314 |
| 2021 | $1,266 | $65,206 | $21,035 | $44,171 |
| 2020 | $1,228 | $64,451 | $20,125 | $44,326 |
| 2019 | $1,191 | $61,790 | $18,970 | $42,820 |
| 2018 | $1,157 | $55,570 | $13,755 | $41,815 |
| 2017 | $1,123 | $54,471 | $12,565 | $41,906 |
| 2016 | $1,095 | $53,343 | $11,410 | $41,933 |
| 2015 | $1,092 | $50,507 | $9,275 | $41,232 |
| 2014 | $1,060 | $39,341 | $7,420 | $31,921 |
| 2013 | -- | $31,774 | $5,250 | $26,524 |
Source: Public Records
Map
Nearby Homes
- 17533 Javalina Ct
- 17527 Sunstone Ct
- 17839 Empire Ct
- 17862 Bear River Ct
- 18300 Alderwood Ct
- 17791 Brushland Dr
- 17115 Garnet Dr
- 5005 Azurite Dr
- 18205 Fontana Ct
- 18248 Silverleaf Ct
- 17130 E Opal Ct
- 3940 Vireo Ct
- 17391 Desert Lake Dr
- 17295 Magnetite Dr
- 4080 Goldfinch Dr
- 17575 Thrush Ln
- 17320 Magnetite Dr
- 17710 Fairfax Ct
- 5085 Bobolink Cir
- 17755 Fantail Cir
- 17553 Javalina Ct
- 17658 Feather River Ct
- 17668 Feather River Ct
- 17648 Feather River Ct
- 17563 Javalina Ct
- 17542 Javalina Ct
- 17532 Javalina Ct
- 17678 Feather River Ct
- 17552 Javalina Ct
- 17638 Feather River Ct
- 17562 Javalina Ct
- 17573 Javalina Ct
- 17522 Javalina Ct
- 17688 Feather River Ct
- 17669 Feather River Ct
- 17659 Feather River Ct
- 17572 Javalina Ct
- 17649 Feather River Ct
- 17347 Bear Lake Dr
- 17679 Feather River Ct
Your Personal Tour Guide
Ask me questions while you tour the home.