Estimated Value: $277,000 - $320,000
3
Beds
2
Baths
1,968
Sq Ft
$155/Sq Ft
Est. Value
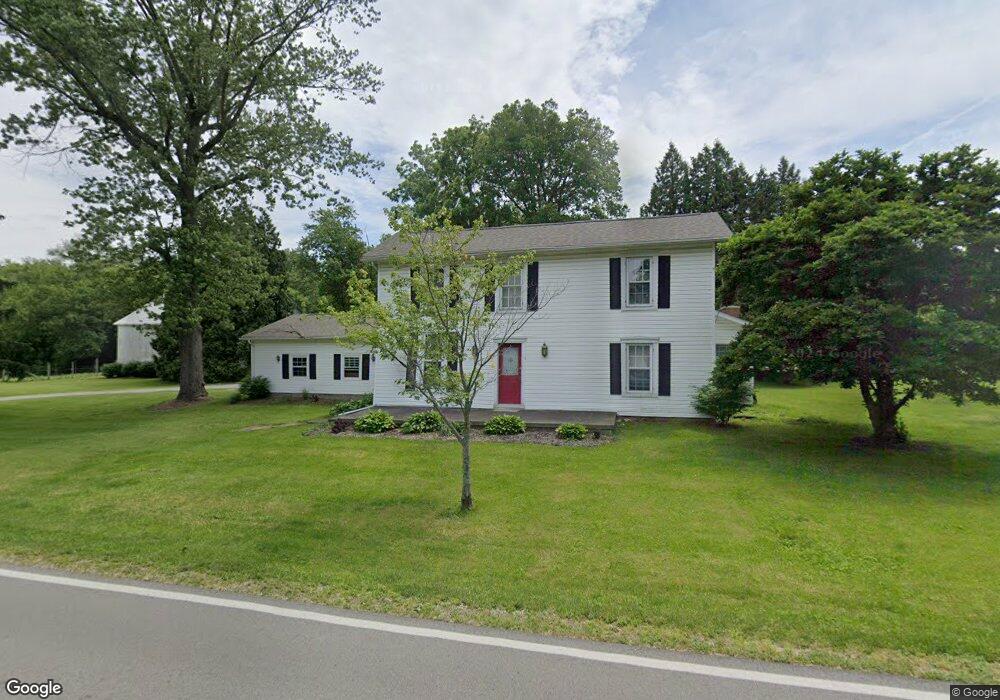
About This Home
This home is located at 1755 Casstown Sidney Rd, Troy, OH 45373 and is currently estimated at $305,565, approximately $155 per square foot. 1755 Casstown Sidney Rd is a home located in Miami County with nearby schools including Miami East Elementary School, Miami East Junior High School, and Miami East High School.
Ownership History
Date
Name
Owned For
Owner Type
Purchase Details
Closed on
Nov 28, 2017
Sold by
Comer Family Trust
Bought by
Comer Zachary R and Comer Melissa S
Current Estimated Value
Home Financials for this Owner
Home Financials are based on the most recent Mortgage that was taken out on this home.
Original Mortgage
$157,570
Outstanding Balance
$132,419
Interest Rate
3.87%
Mortgage Type
FHA
Estimated Equity
$173,146
Purchase Details
Closed on
May 19, 2014
Sold by
Estate Of Sandra S Comer
Bought by
Comer William R and Comer Family Revocable Living Trust
Purchase Details
Closed on
Dec 10, 2010
Sold by
Comer William R and Comer Sandra S
Bought by
Comer William R and Comer Sandra S
Purchase Details
Closed on
Apr 28, 2006
Sold by
Comer William R and Comer Sandra S
Bought by
Comer William R and Comer Sandra S
Purchase Details
Closed on
Jan 1, 1990
Bought by
Comer Wm R
Create a Home Valuation Report for This Property
The Home Valuation Report is an in-depth analysis detailing your home's value as well as a comparison with similar homes in the area
Home Values in the Area
Average Home Value in this Area
Purchase History
| Date | Buyer | Sale Price | Title Company |
|---|---|---|---|
| Comer Zachary R | $164,500 | -- | |
| Comer William R | -- | None Available | |
| Comer William R | -- | -- | |
| Comer William R | -- | -- | |
| Comer Wm R | -- | -- |
Source: Public Records
Mortgage History
| Date | Status | Borrower | Loan Amount |
|---|---|---|---|
| Open | Comer Zachary R | $157,570 |
Source: Public Records
Tax History Compared to Growth
Tax History
| Year | Tax Paid | Tax Assessment Tax Assessment Total Assessment is a certain percentage of the fair market value that is determined by local assessors to be the total taxable value of land and additions on the property. | Land | Improvement |
|---|---|---|---|---|
| 2024 | $1,932 | $56,910 | $12,740 | $44,170 |
| 2023 | $1,932 | $56,910 | $12,740 | $44,170 |
| 2022 | $1,984 | $56,910 | $12,740 | $44,170 |
| 2021 | $1,757 | $47,430 | $10,610 | $36,820 |
| 2020 | $1,766 | $47,430 | $10,610 | $36,820 |
| 2019 | $1,863 | $47,430 | $10,610 | $36,820 |
| 2018 | $1,438 | $36,750 | $10,570 | $26,180 |
| 2017 | $1,086 | $36,750 | $10,570 | $26,180 |
| 2016 | $1,020 | $36,750 | $10,570 | $26,180 |
| 2015 | $1,027 | $35,320 | $10,150 | $25,170 |
| 2014 | $1,027 | $35,320 | $10,150 | $25,170 |
| 2013 | $1,032 | $35,320 | $10,150 | $25,170 |
Source: Public Records
Map
Nearby Homes
- 107 N Main St
- 12 N Main St
- 72 N Childrens Home Rd
- 1760 Hunters Ridge Dr
- 1947 Woodcliffe Dr
- 1500 Paradise Trail
- 1400 Troy Urbana Rd
- 1310 Saratoga Dr
- 1002 Stonyridge Ave
- 1329 Lee Rd
- 4845 E Troy Urbana Rd
- 429 Forrest Ln
- 1075 Crestview Dr
- 1188 E Bentley Cir
- 1160 Waterloo St
- 1164 Waterloo St
- 1137 Auburn St
- 838 W Bentley Cir
- 1750 Casstown Sidney Rd
- 3733 Burton Rd
- 1720 Casstown Sidney Rd
- 3791 Burton Rd
- 3730 Burton Rd
- 1690 Casstown Sidney Rd
- 1705 Casstown Sidney Rd
- 3760 Burton Rd
- 3790 Burton Rd
- 1660 Casstown Sidney Rd
- 3835 Burton Rd
- 3810 Burton Rd
- 1885 Casstown Sidney Rd
- 1695 Casstown Sidney Rd
- 1600 Casstown Sidney Rd
- 1600 Casstown-Sidney Rd
- 3830 Burton Rd
- 1880 Casstown Sidney Rd
- 3850 Burton Rd
- 1860 Casstown Sidney Rd