1755 Naughton Way Belleville, IL 62226
Estimated Value: $337,075 - $371,000
3
Beds
2
Baths
2,128
Sq Ft
$165/Sq Ft
Est. Value
About This Home
This home is located at 1755 Naughton Way, Belleville, IL 62226 and is currently estimated at $351,769, approximately $165 per square foot. 1755 Naughton Way is a home located in St. Clair County with nearby schools including Abraham Lincoln Elementary School, West Jr High School, and Elite Scholars STEAM Academy.
Ownership History
Date
Name
Owned For
Owner Type
Purchase Details
Closed on
Oct 5, 2009
Sold by
Doss Steven K and Doss Jean J
Bought by
Mason Reenai E
Current Estimated Value
Home Financials for this Owner
Home Financials are based on the most recent Mortgage that was taken out on this home.
Original Mortgage
$160,000
Outstanding Balance
$105,063
Interest Rate
5.19%
Mortgage Type
New Conventional
Estimated Equity
$246,706
Purchase Details
Closed on
May 16, 2005
Sold by
The Jones Co Homes Llc
Bought by
Doss Steven K and Doss Jean J
Home Financials for this Owner
Home Financials are based on the most recent Mortgage that was taken out on this home.
Original Mortgage
$195,964
Interest Rate
4.87%
Mortgage Type
Fannie Mae Freddie Mac
Purchase Details
Closed on
Dec 13, 2004
Sold by
Veile Construction Inc
Bought by
The Jones Co Homes Llc
Purchase Details
Closed on
Oct 19, 2004
Sold by
Sullivan Farms Llc
Bought by
Veile Construction Inc Of Illinois
Create a Home Valuation Report for This Property
The Home Valuation Report is an in-depth analysis detailing your home's value as well as a comparison with similar homes in the area
Home Values in the Area
Average Home Value in this Area
Purchase History
| Date | Buyer | Sale Price | Title Company |
|---|---|---|---|
| Mason Reenai E | $200,000 | Benchmark Title Company Llc | |
| Doss Steven K | $245,000 | Benchmark Title Company | |
| The Jones Co Homes Llc | $195,000 | Town & Country Title Co | |
| Veile Construction Inc Of Illinois | $1,039,500 | Town & Country Title Co |
Source: Public Records
Mortgage History
| Date | Status | Borrower | Loan Amount |
|---|---|---|---|
| Open | Mason Reenai E | $160,000 | |
| Previous Owner | Doss Steven K | $195,964 |
Source: Public Records
Tax History Compared to Growth
Tax History
| Year | Tax Paid | Tax Assessment Tax Assessment Total Assessment is a certain percentage of the fair market value that is determined by local assessors to be the total taxable value of land and additions on the property. | Land | Improvement |
|---|---|---|---|---|
| 2024 | $6,937 | $98,453 | $13,983 | $84,470 |
| 2023 | $6,749 | $91,019 | $13,790 | $77,229 |
| 2022 | $6,322 | $82,895 | $12,559 | $70,336 |
| 2021 | $6,204 | $79,493 | $12,044 | $67,449 |
| 2020 | $5,987 | $74,030 | $11,216 | $62,814 |
| 2019 | $5,484 | $70,111 | $11,445 | $58,666 |
| 2018 | $5,369 | $68,321 | $11,153 | $57,168 |
| 2017 | $5,285 | $66,504 | $10,857 | $55,647 |
| 2016 | $5,321 | $64,212 | $10,483 | $53,729 |
| 2014 | $5,081 | $70,520 | $12,544 | $57,976 |
| 2013 | $4,784 | $70,520 | $12,544 | $57,976 |
Source: Public Records
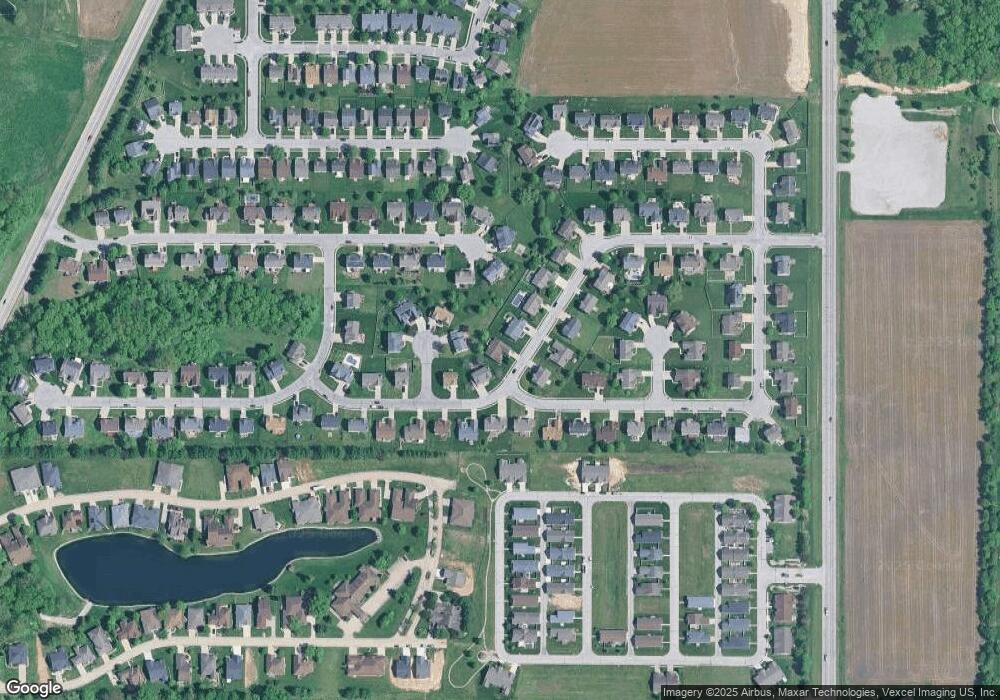
Map
Nearby Homes
- 1757 Old Park Ln
- 1753 Old Park Ln
- 3928 Finch Ln
- 1749 Old Park Ln
- 1745 Old Park Ln
- 3924 Finch Ln
- 3920 Finch Ln
- 1737 Old Park Ln
- 3916 Finch Ln
- 3909 Finch Ln
- 3928 Red Bird Ln
- 3912 Finch Ln
- 3924 Red Bird Ln
- 3908 Finch Ln
- 3920 Red Bird Ln
- 1829 Carrington Way
- 3909 Red Bird Ln
- 1835 Carrington Way
- 3916 Red Bird Ln
- 3904 Finch Ln
- 1751 Naughton Way
- 1759 Naughton Way
- 1763 Naughton Way
- 1754 Naughton Way
- 1747 Naughton Way
- 1750 Naughton Way
- 4108 Endicott Ct
- 1762 Dalton Dr
- 1758 Naughton Way
- 1766 Dalton Dr
- 1746 Naughton Way
- 4060 Bassen Dr
- 1762 Naughton Way
- 1743 Naughton Way
- 4069 Bassen Dr
- 1783 Naughton Way
- 1766 Naughton Way
- 4064 Bassen Dr
- 4109 Endicott Ct
- 1770 Dalton Dr