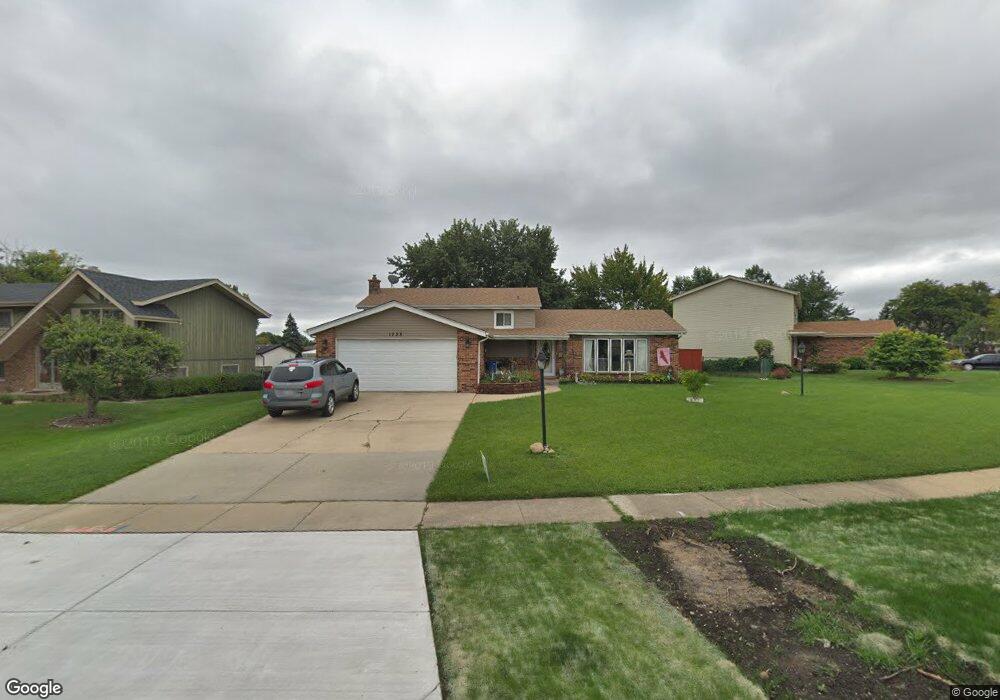
1755 W Jo Ann Ln Addison, IL 60101
Estimated Value: $358,191 - $433,000
Studio
1
Bath
2,210
Sq Ft
$183/Sq Ft
Est. Value
About This Home
This home is located at 1755 W Jo Ann Ln, Addison, IL 60101 and is currently estimated at $403,798, approximately $182 per square foot. 1755 W Jo Ann Ln is a home located in DuPage County with nearby schools including Stone Elementary School, Indian Trail Jr High School, and Addison Trail High School.
Ownership History
Date
Name
Owned For
Owner Type
Purchase Details
Closed on
Apr 24, 2012
Sold by
Ramirez Debra R and Beaver Linda
Bought by
Ramirez Debra R and Beaver Linda D
Current Estimated Value
Purchase Details
Closed on
May 21, 2010
Sold by
Ramirez Debra R
Bought by
Ramirez Debra R and Beaver Linda
Home Financials for this Owner
Home Financials are based on the most recent Mortgage that was taken out on this home.
Original Mortgage
$216,218
Interest Rate
5.5%
Mortgage Type
FHA
Purchase Details
Closed on
Aug 21, 2008
Sold by
Ramirez Debra R and The Irene Romanchuk Declaratio
Bought by
Ramirez Debra R
Home Financials for this Owner
Home Financials are based on the most recent Mortgage that was taken out on this home.
Original Mortgage
$160,000
Interest Rate
6.55%
Mortgage Type
Stand Alone Refi Refinance Of Original Loan
Purchase Details
Closed on
Nov 17, 2003
Sold by
Romanchuk Irene
Bought by
Romanchuk Irene and Trust #1
Create a Home Valuation Report for This Property
The Home Valuation Report is an in-depth analysis detailing your home's value as well as a comparison with similar homes in the area
Home Values in the Area
Average Home Value in this Area
Purchase History
| Date | Buyer | Sale Price | Title Company |
|---|---|---|---|
| Ramirez Debra R | -- | None Available | |
| Ramirez Debra R | -- | First American Title | |
| Ramirez Debra R | -- | Ctic | |
| Romanchuk Irene | -- | -- |
Source: Public Records
Mortgage History
| Date | Status | Borrower | Loan Amount |
|---|---|---|---|
| Closed | Ramirez Debra R | $216,218 | |
| Closed | Ramirez Debra R | $160,000 |
Source: Public Records
Tax History
| Year | Tax Paid | Tax Assessment Tax Assessment Total Assessment is a certain percentage of the fair market value that is determined by local assessors to be the total taxable value of land and additions on the property. | Land | Improvement |
|---|---|---|---|---|
| 2024 | $7,892 | $127,979 | $50,974 | $77,005 |
| 2023 | $7,483 | $117,650 | $46,860 | $70,790 |
| 2022 | $7,772 | $111,530 | $44,410 | $67,120 |
| 2021 | $7,447 | $106,830 | $42,540 | $64,290 |
| 2020 | $7,245 | $102,330 | $40,750 | $61,580 |
| 2019 | $7,194 | $98,390 | $39,180 | $59,210 |
| 2018 | $7,071 | $93,100 | $37,300 | $55,800 |
| 2017 | $6,888 | $88,980 | $35,650 | $53,330 |
| 2016 | $6,702 | $82,150 | $32,910 | $49,240 |
| 2015 | $6,533 | $75,890 | $30,400 | $45,490 |
| 2014 | $6,235 | $72,270 | $31,350 | $40,920 |
| 2013 | $6,109 | $73,740 | $31,990 | $41,750 |
Source: Public Records
Map
Nearby Homes
- 1651 W Goldengate Dr
- 1770 W Windmill Ct
- 823 N Harrow Ct
- 940 N Rohlwing Rd Unit 201A
- 953 N Rohlwing Rd Unit GB
- 1354 W Byron Ave Unit D
- 551 N Plamondon Dr
- 1306 W Byron Ave
- 1210 N Foxdale Dr Unit 109
- 1259 W Lake St Unit 203
- 865 N Tamarac Blvd
- 1200 N Foxdale Dr Unit 205
- 1200 N Foxdale Dr Unit 100
- 881 N Swift Rd Unit 206
- 941 N Swift Rd Unit 302
- 1113 N Itasca Rd
- 1137 N Itasca Rd
- 19W720 Woodland Ave
- 5N210 Central Rd
- 1227 N Ashley Ln
- 1711 W Jo Ann Ln
- 1785 W Jo Ann Ln
- 1730 W Byron Ave
- 1701 W Jo Ann Ln
- 1720 W Byron Ave
- 1730 W Jo Ann Ln
- 1681 W Jo Ann Ln
- 1750 W Jo Ann Ln
- 1710 W Jo Ann Ln
- 1760 W Jo Ann Ln
- 1770 W Jo Ann Ln
- 1700 W Jo Ann Ln
- 1671 W Jo Ann Ln
- 1780 W Jo Ann Ln
- 1790 W Jo Ann Ln
- 1680 W Jo Ann Ln
- 1760 W Byron Ave
- 4N108 Rohlwing Rd
- 1731 W Byron Ave
- 1731 W Goldengate Dr
Your Personal Tour Guide
Ask me questions while you tour the home.